
|
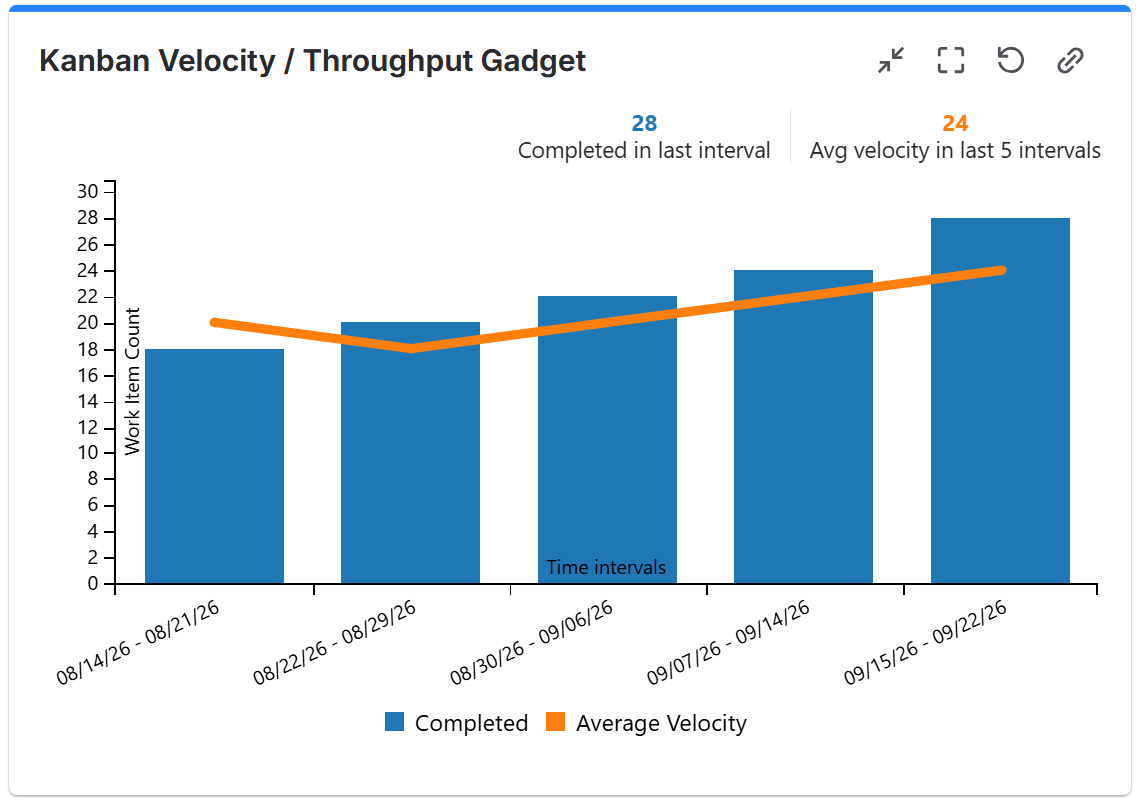
Kanban Velocity Gadget Calculates and displays the current average velocity / throughput of the Agile (Kanban) team based on the Jira issue filter or Agile board. Use this gadget to see how many story points your team burns along the time. For more details, see Kanban Velocity Gadget agile Kanban project management release management |
|
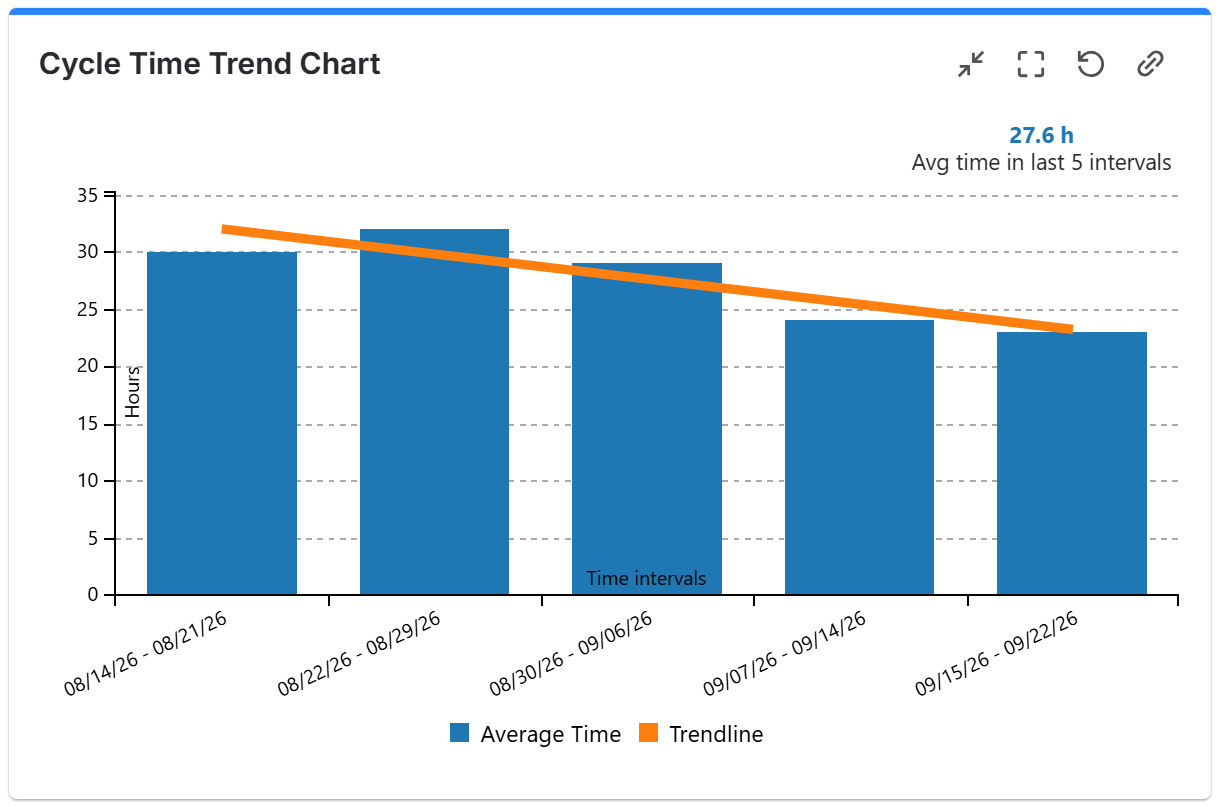
Cycle Time Trend Gadget Calculates the key Kanban metrics Cycle Time and Lead Time or simply the time between statuses and displays them as a trend chart. Use this gadget to see how fast your team delivers and to identify bottlenecks in your process flow. For more details, see Cycle Time Trend Gadget agile Kanban project management release management |
|
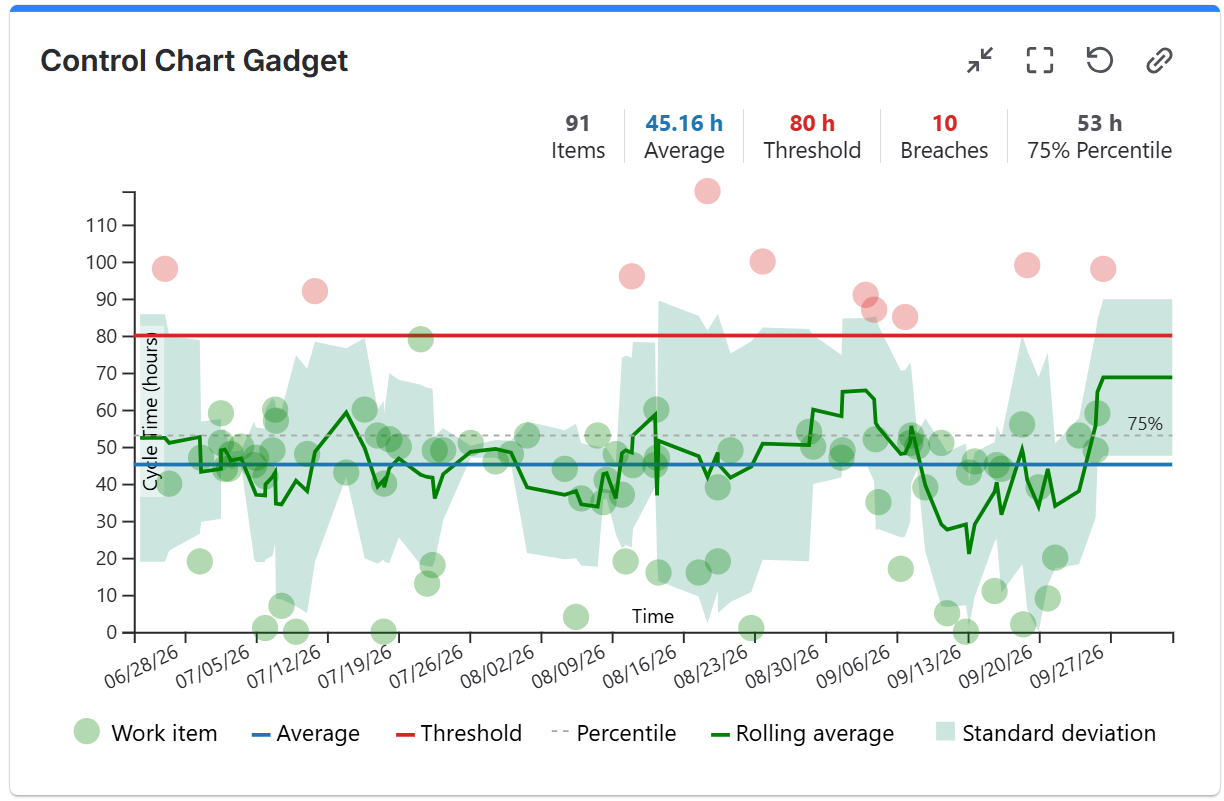
Control Chart Gadget Control chart based on the cycle time of the issues from a filter. It shows the issues with their cycle time as well as the average line, trend (rolling average) line and standard deviation. A custom threshold line can be also added for easily identifying the issues that had a too long cycle time. Use this gadget to see how quickly your team delivers and to identify the issues that took longer than expected. For more details, see Control Chart Gadget agile Kanban project management release management |
|
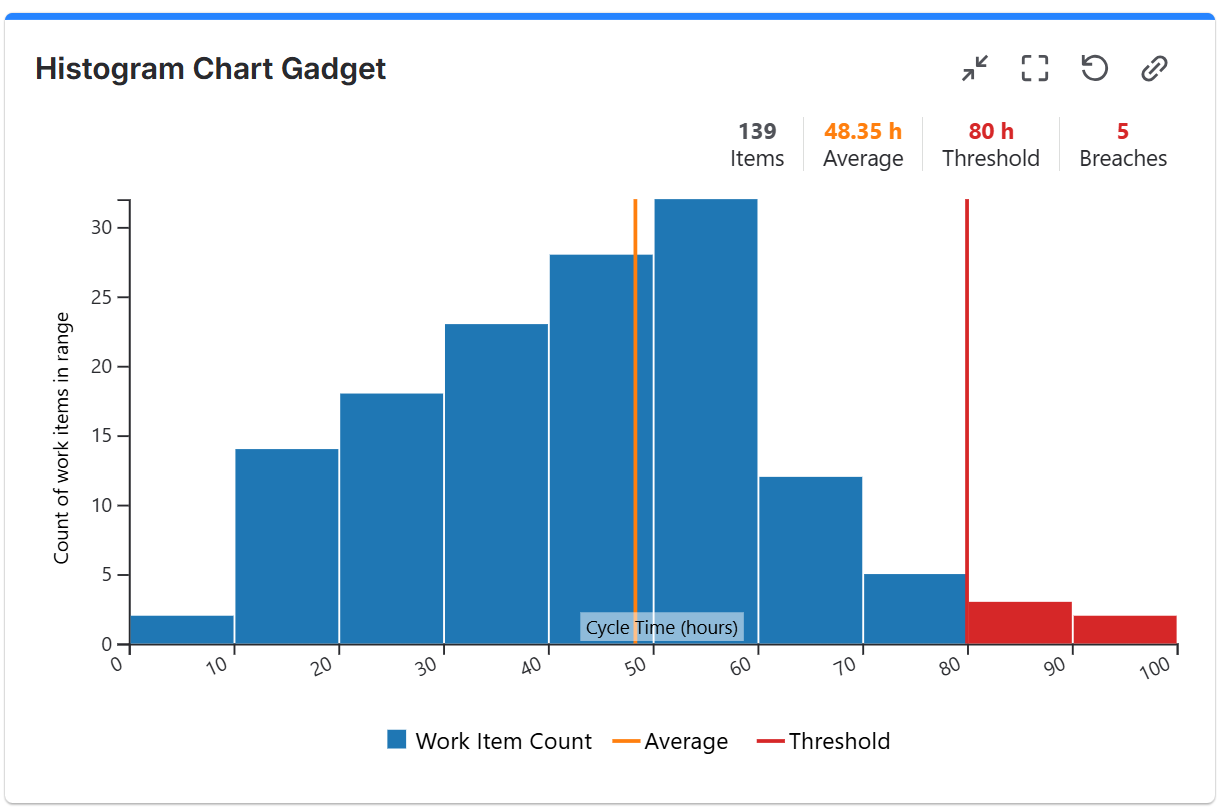
Histogram Chart Gadget Histogram chart based on the cycle time of the issues from a filter. The chart plots the distribution of the issues cycle time as a series of bars. A custom threshold line can be also added for identifying how many issues had a longer cycle time than expected. Use this gadget to see how your team delivers, how many issues were resolved in the expected time frame and how many were not. For more details, see Histogram Chart Gadget agile Kanban project management release management |