
Overview
This gadget allows displaying the result of up to 9 calculations of math formulas applied against the numerical fields or the count of the work items from multiple Jira filters. Comparing with the work item Filter Formula Gadget, it allows displaying up to 9 calculations results (instead of one), combines data from up to 9 filters (instead of one) and can do more advanced calculations (not only SUM, COUNT, AVG, MIN or MAX). For example, you could use this gadget to calculate and display the percent of work done or the percent of budget spent.
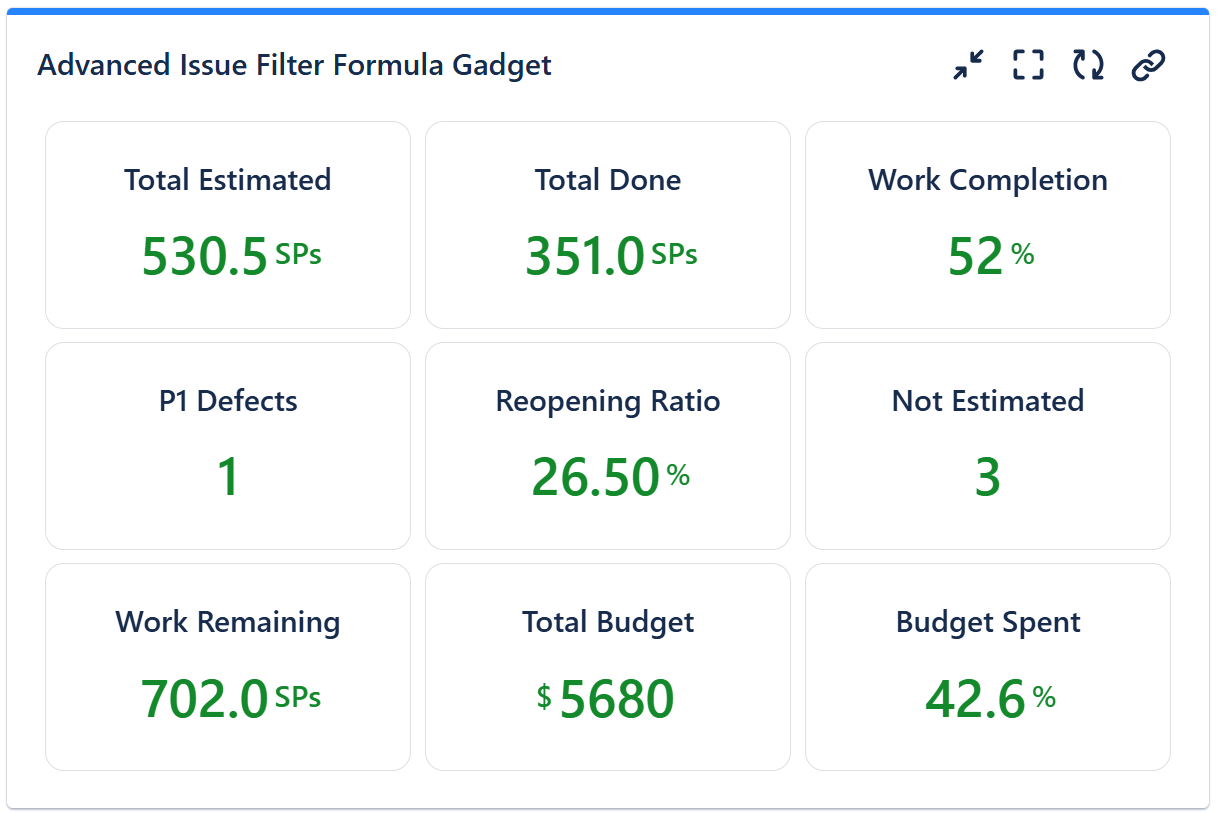
How does it work? The gadget lets you define up to 9 variables ('a', 'b', 'c', 'd', 'e', 'f', 'g', 'h', and 'i') calculated as COUNT, SUM, MAX, MIN or AVERAGE for a numeric field of the work items from a specified Jira work item filter. Then, you can combine these variables into up to 9 math formulas and display their results.
You can also use more advanced math functions, such as SQRT, LOG, ROUND and others. For a complete list of supported functions, please see https://ezylang.github.io/EvalEx/references/functions.html.
Configuration
The settings of this gadget are divided in multiple tabs:
-
Data tab - contains the required settings of the gadget, such as title or data source
-
More Settings tab - contains the optional settings, such as display mode and refresh interval.
Data tab
On this tab you can configure the required settings of the gadget.
|
Setting |
Description |
|---|---|
|
Gadget Title |
Choose what to display in the title bar of the gadget. |
|
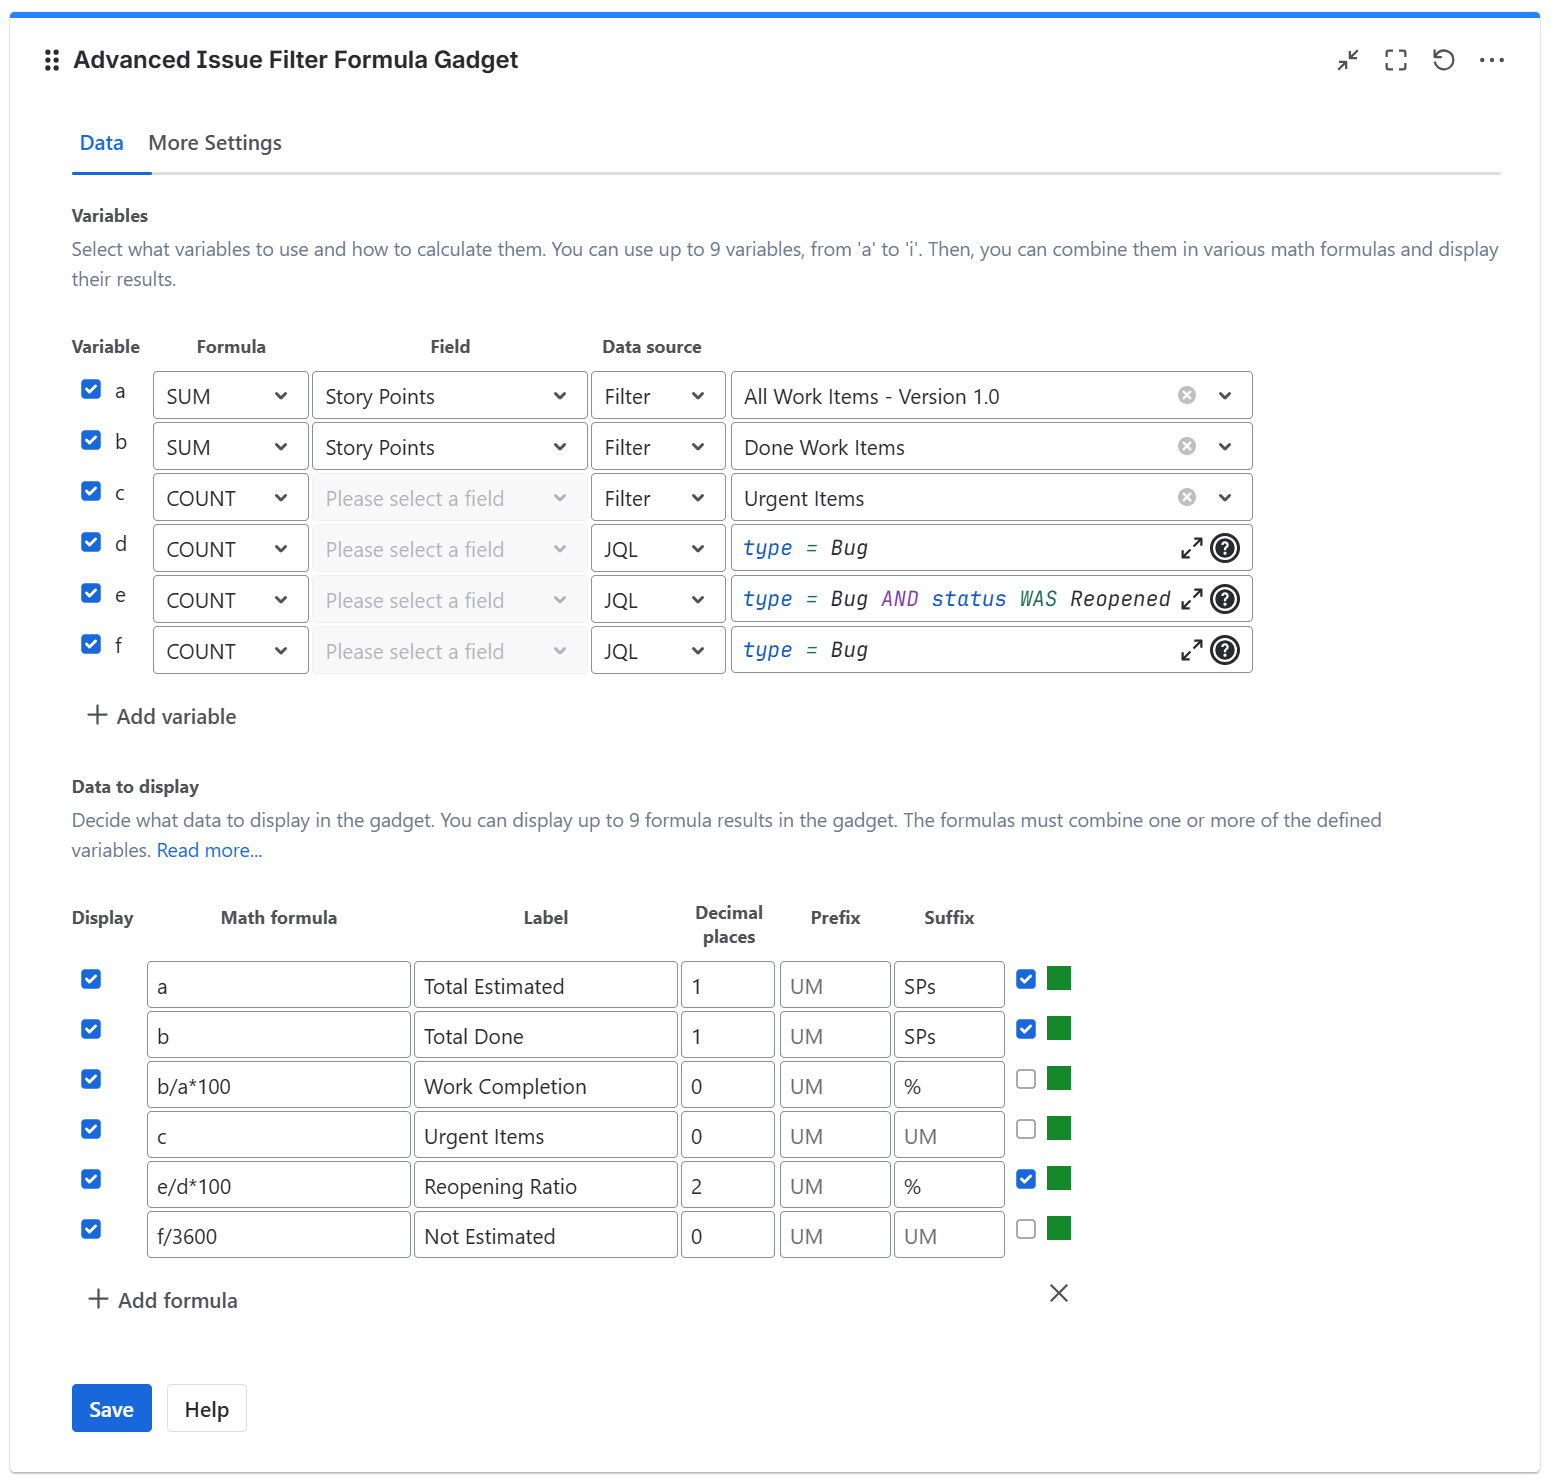
Variables |
Select the variable(s) 'a', 'b', 'c', 'd', 'e', 'f', 'g', 'h' or 'i' that you need and specify how they are calculated. By default, there are only 2 variable displayed, but you can use the Add (+) button to add up to 9 variables. For each of them, choose the Formula (SUM, MIN, MAX, COUNT or AVG) that is applied against the selected Field of the work items returned by the selected Filter or JQL string.
|
|
Data To Display |
Decide what numbers to display in the gadget by entering Math Formulas that combine one or more of the selected variables. By default, there are only 2 formula fields displayed, but you can use the Add (+) button to add up to 9 formulas. For each formula, enter a Label and specify with how many Decimals the formula result shall be displayed.
Color Settings You can customize the display color of the value by clicking the green square on the right side. By default, the value is shown in green, but you can choose any color to better suit your needs. 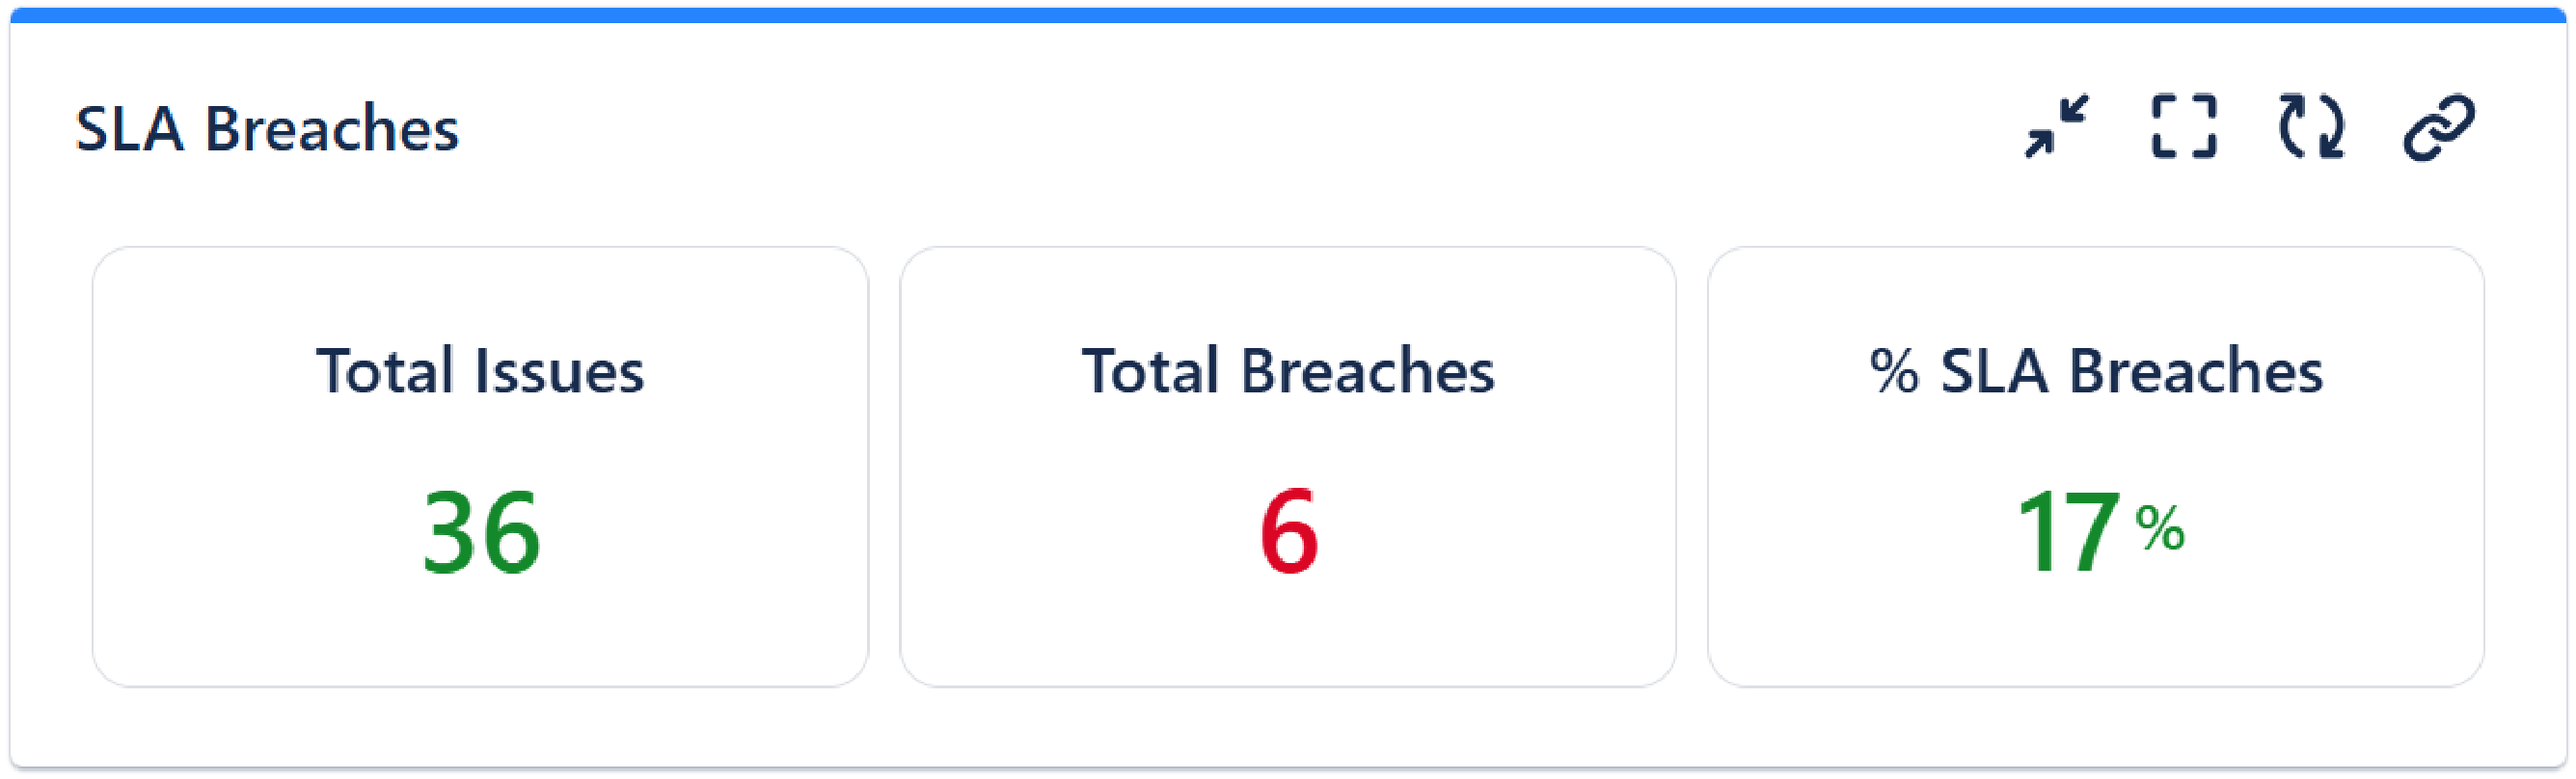
Choose how the displayed results should be colored:

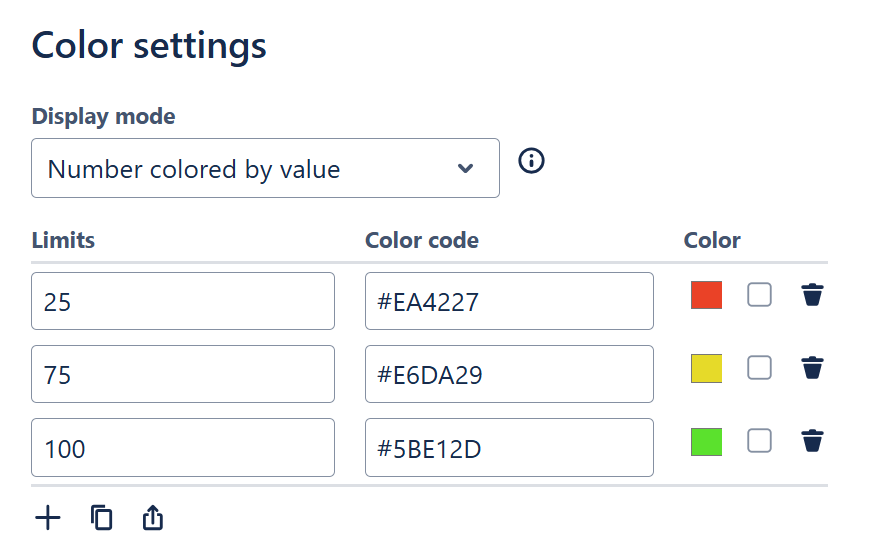
If you check Extra highlight by coloring border, the gadget will color the border in the same color. 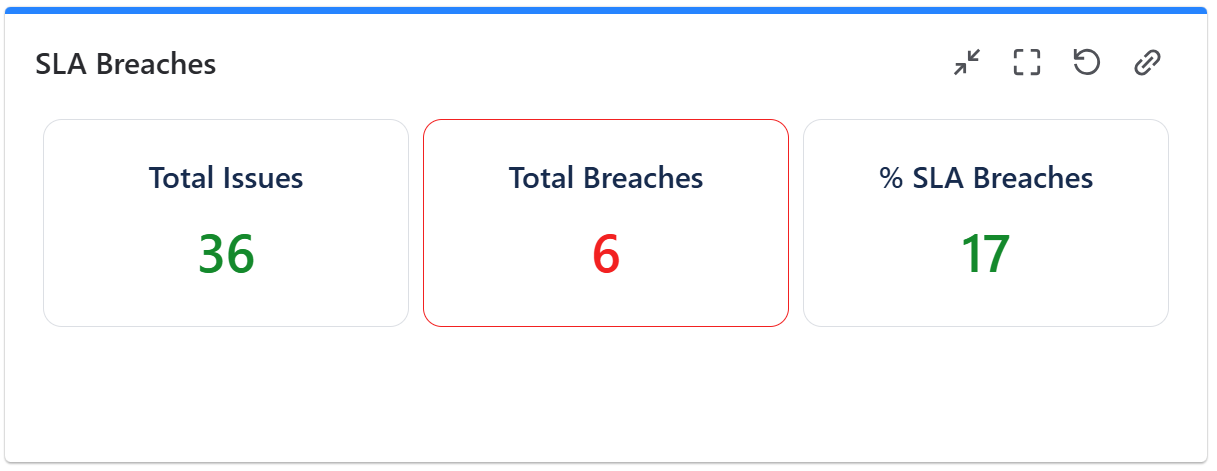
|
Example: Let's assume that you want to display the percent of work done (by story points) for a project. Here are the steps to perform:
-
You have to create two filters:
-
a filter that returns all the work items from the project.
-
a filter that returns only the work items from the project that are done.
-
-
Then, you have to define two variables:
-
'a' that will be calculated as the SUM of Story Points field of the work items from the first filter. This represents the total estimated work, in story points.
-
'b' that will be calculated as the SUM of Story Points field of the work items from the second filter. This represents the total amount of work done, in story points.
-
-
Finally, display the numbers by entering the following math formulas:
-
'a' - to display the value of 'a' variable representing the total estimated work.
-
'b' - to display the value of 'b' variable representing the total work done.
-
'(b / a) * 100' - to calculate and display the percent of work done
-
-
Proceed in the same way to calculate and display other project key-numbers.
The gadget displays 'NaN' (Not a Number) if the result of the formula cannot be calculated. This can happen in case of division by zero or when one of the variables cannot be calculated (for example, the AVG or MAX for a filter that returns no work items).
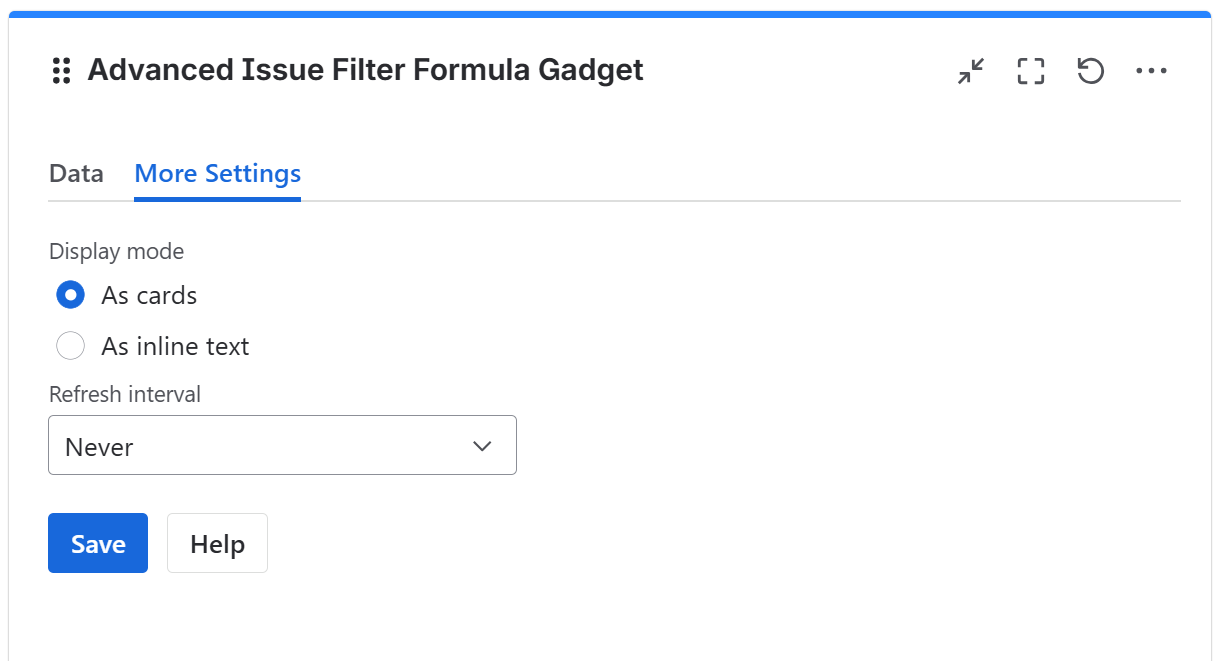
More Settings tab
On this tab you can configure the optional settings of the gadget.
|
Setting |
Description |
|---|---|
|
Display mode |
Choose how the formula results will be displayed. As cards - check this option to display the results in a card format. Best for dashboards where you want to highlight and draw attention to key metrics. 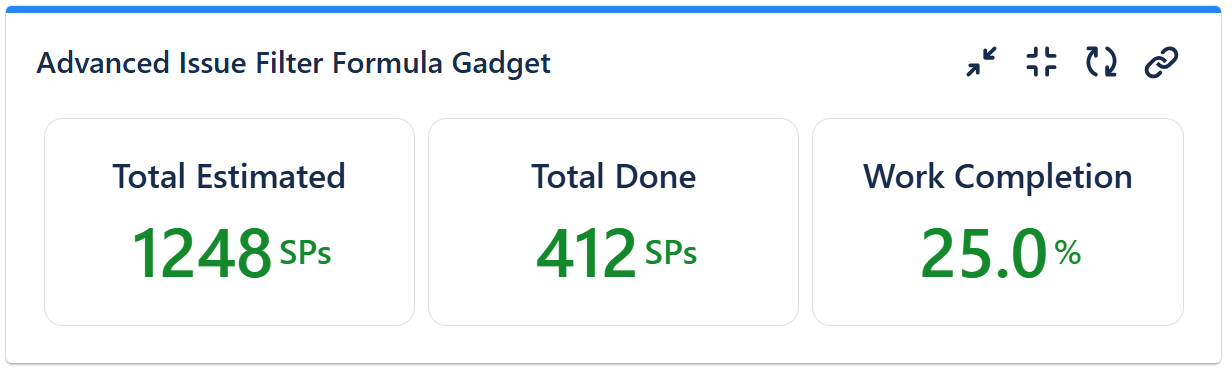
As inline text - check this option to display the results as simple text, which fits better in compact layouts like tables in Confluence. 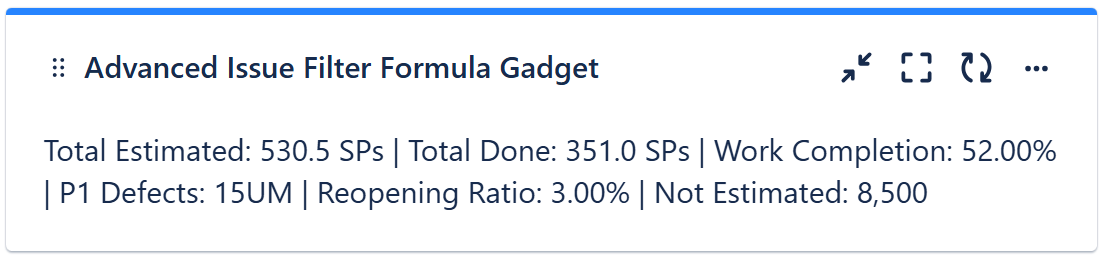
|
|
Refresh interval |
Choose how often the gadget will refresh automatically. |
Related blog articles
The following blog articles provide more information on how to use this gadget.
-
How to track multi-team or scaled-agile projects (such as SAFe®) in Jira with Great Gadgets app
-
An effective dashboard for Service Desk and Customer Support teams in Jira Service Management
-
How to measure customer satisfaction in Jira or Confluence with Great Gadgets app
-
7 Essential Team Performance Metrics To Track In Jira By Using Great Gadgets App