Understanding how long work items spend in each workflow status is critical for teams of any kind, whether using agile or not. It is a key factor in planning, monitoring and improving team and workflow performance.
In this guide, you’ll learn how to configure the Time In Status gadget from Great Gadgets to create real-time dashboards that adapt to any workflow, team or role — helping you analyze efficiency and spot bottlenecks directly in Jira.
The Challenge: Why Time-in-Status Tracking is Limited in Jira
Jira offers some native options to track time in status, but they have limitations:
-
Average Time In Status gadget: Provides a basic visualization of the average time spent per status, but lacks flexible grouping, aggregation and advanced visualizations.
-
Days in Column (on boards): Displays approximate days in status using dots on work item cards. Requires Jira admin access to enable, cannot exclude weekends and only shows days, not precise hours.
But if teams look for a unified view in Jira dashboards, this can’t be achieved using only the built-in solutions. Therefore, teams cannot easily identify workflow bottlenecks, compare performance across projects or create dashboards that reflect real efficiency.
The Solution: Time In Status Gadget offered by Great Gadgets
The Time In Status gadget solves these challenges by providing a fully configurable and very efficient way to measure time in status, helping teams gain actionable insights. It can:
-
Measures how long each work item stays in a workflow status, status category or board column.
-
Calculate total time or average time in hours, days or minutes.
-
Calculate the subtasks.
-
Include or exclude specific statuses or status categories.
-
Group data by assignee, project, priority or other custom fields.
-
Display results as pie chart, bar chart, column or stacked column charts.
-
Help identify the slow parts of the workflow and understand team performance.
Here’s how to set up the Time In Status gadget:
1. Add the Time In Status gadget to your dashboard
-
Make sure you already have Great Gadgets app installed in your Jira instance. If not, you can install it from the Atlassian Marketplace: Great Gadgets for Jira Cloud, Great Gadgets for Jira Data Center, Great Gadgets for Confluence.
-
Go to your Jira dashboard and click Add Gadget.
-
Search for Time In Status gadget and click Add.
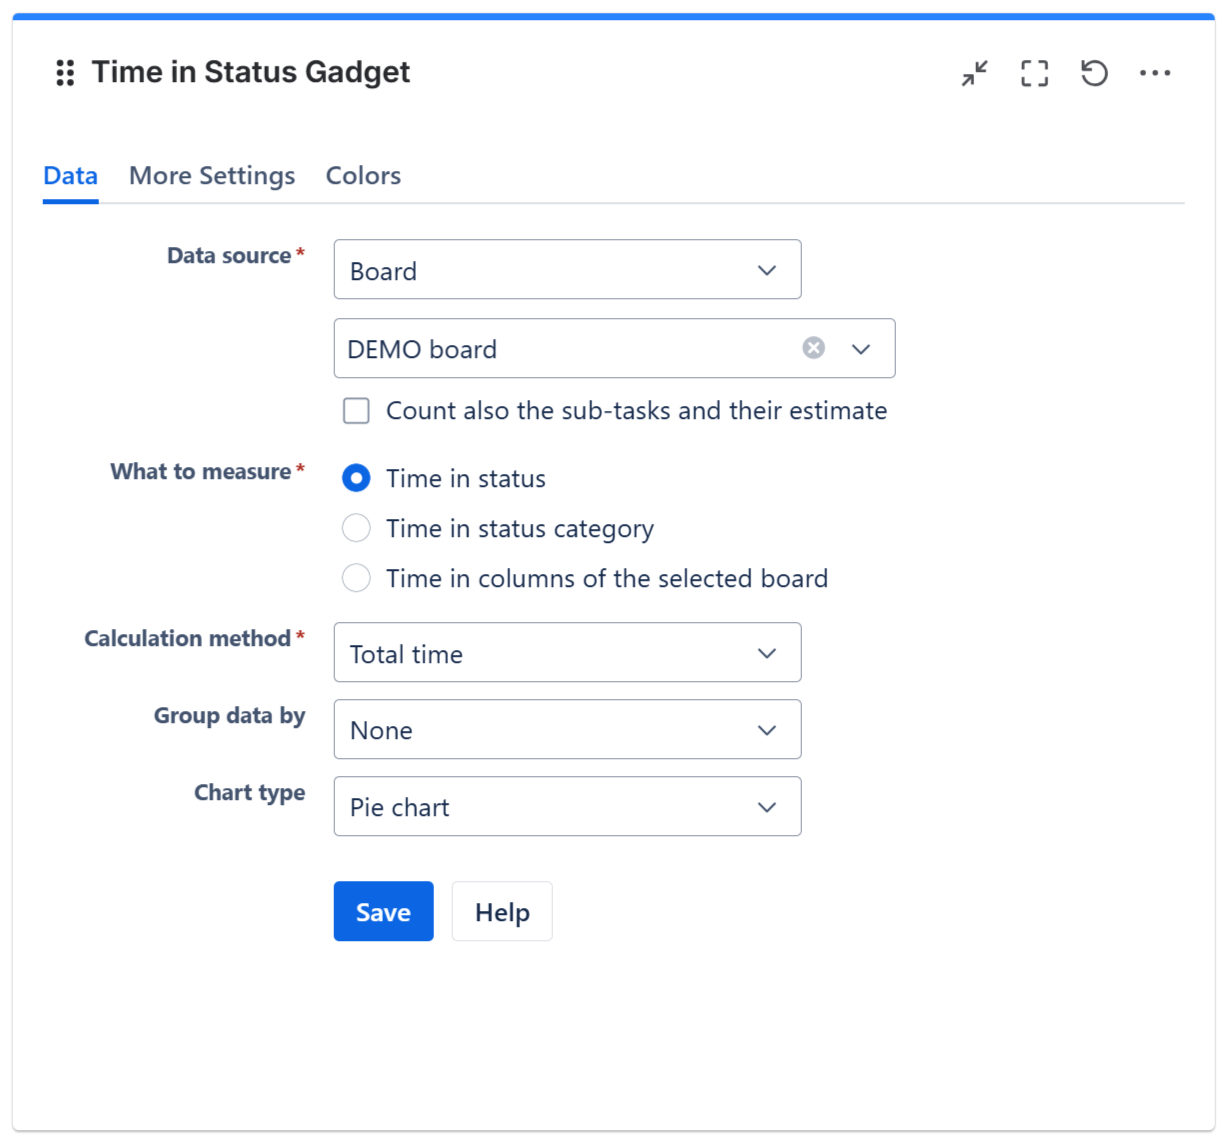
2. Configure the Gadget
-
Select a board, a filter or enter a JQL that returns the work items you want
-
Select what to measure: time in status, time in status category or time in columns of the selected board
-
Select to calculate the Total Time or Average Time
-
Optionally, you can choose a grouping criteria such as assignee, project, priority or custom fields
-
Select visualization type: pie, bar, column or stacked column chart
-
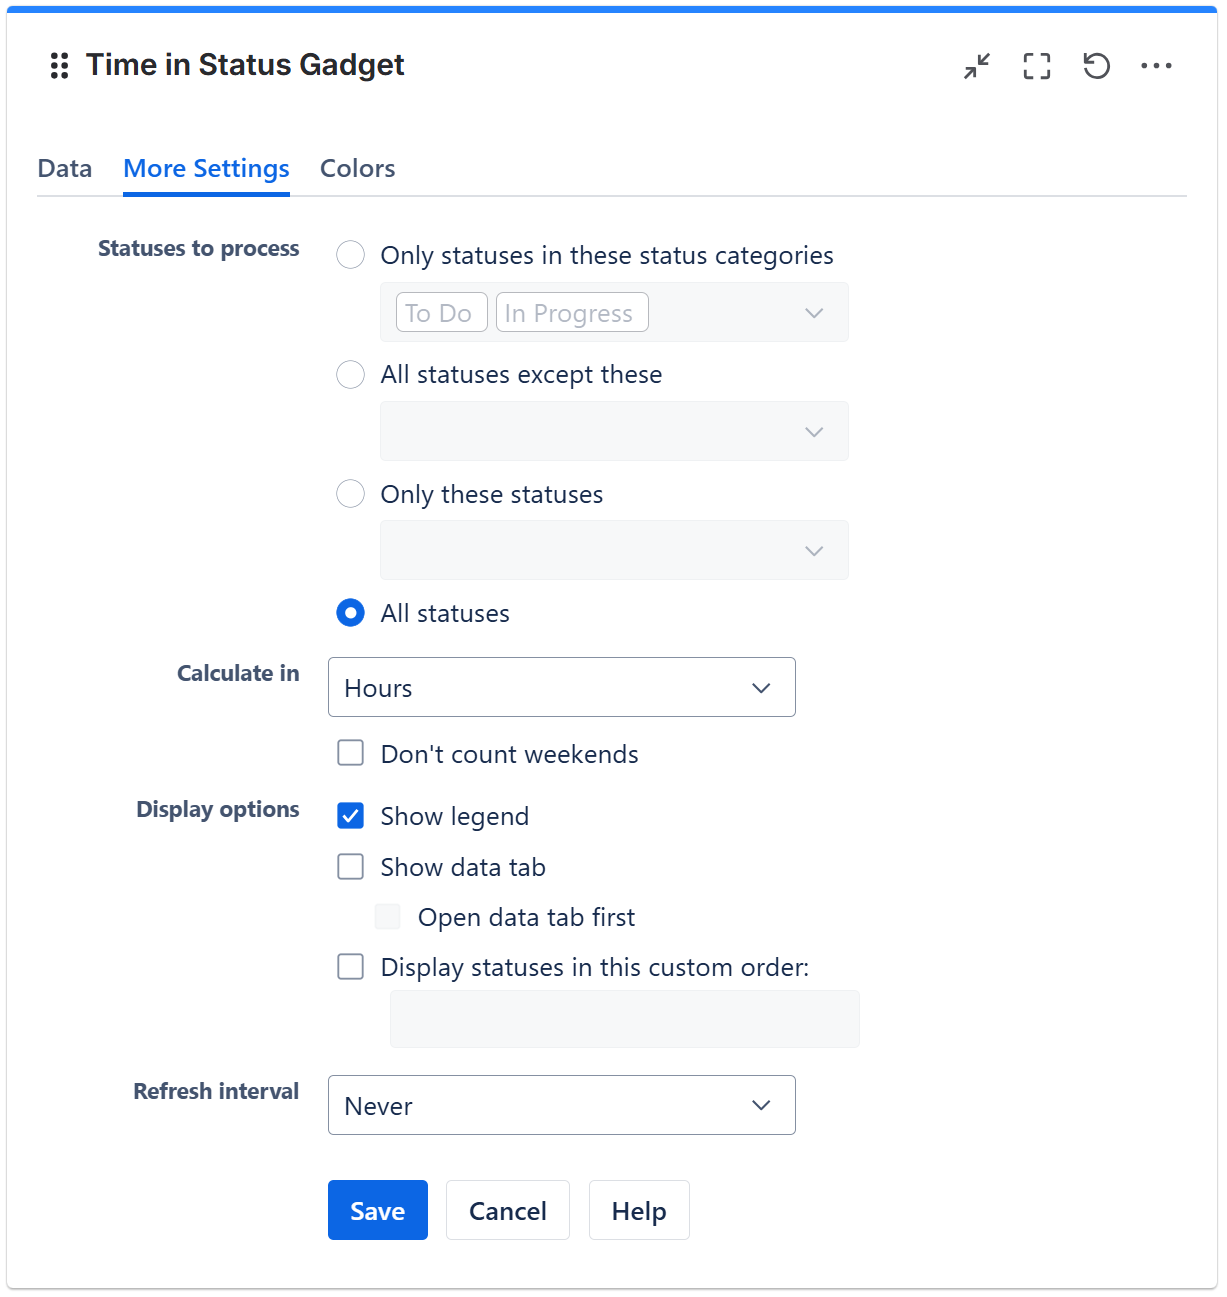
In the More Settings tab further customize the gadget
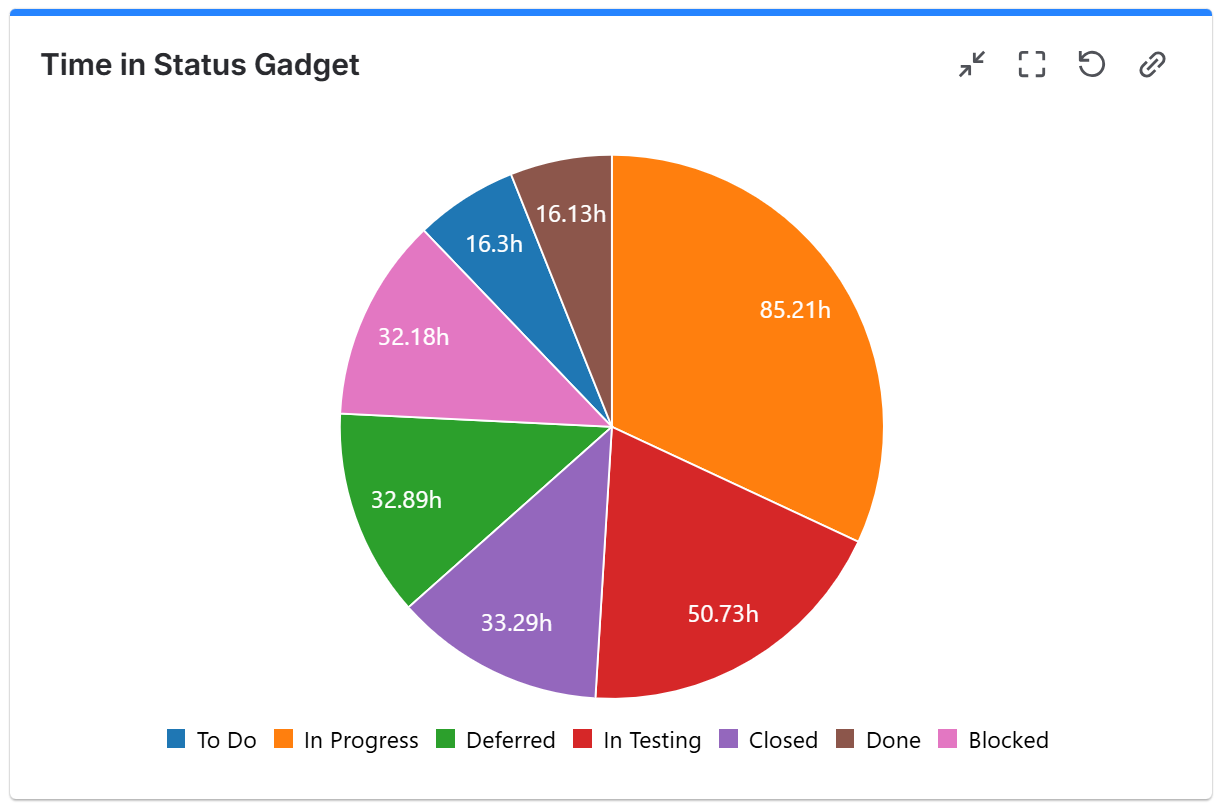
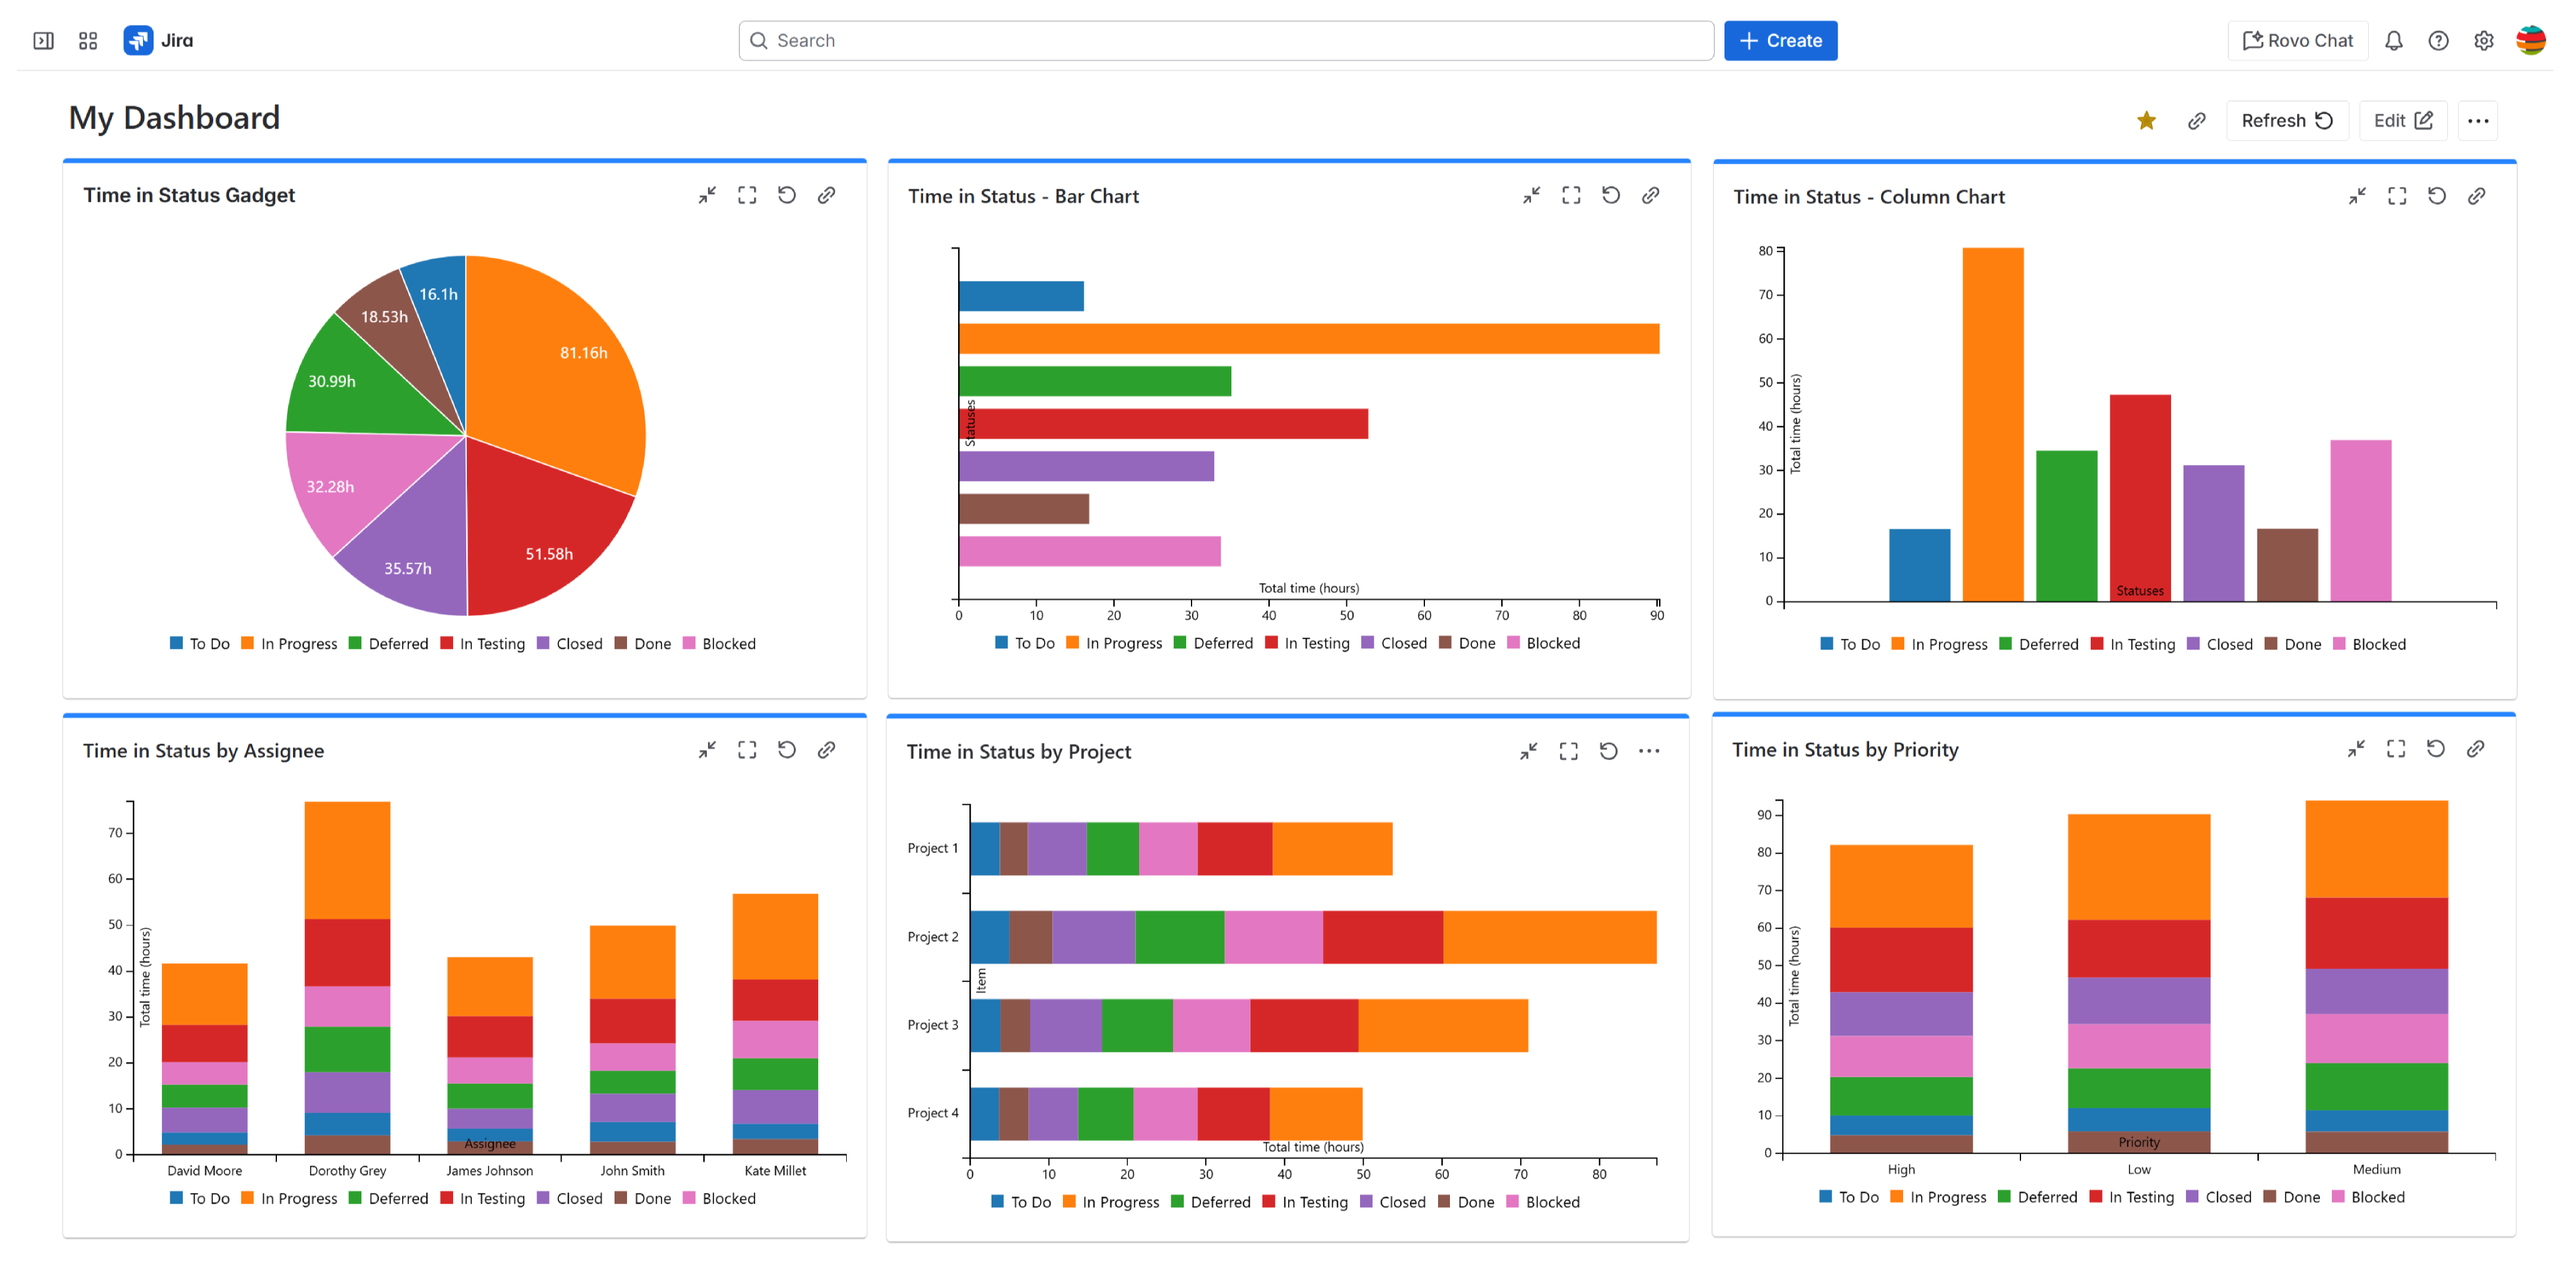
The Result: Understand Time In Status at a Glance
Once configured, the Time In Status gadget helps you quickly understand where work items are spending the most time and which workflow step may be causing delays.
-
View how long work items stay in each workflow step
-
Identify which parts of the workflow takes the most time or slows-down the flow
-
Understand team performance across projects, or the performance of each team member
💡 Tip: Make your dashboards truly reflect your workflow by combining grouping and chart types.
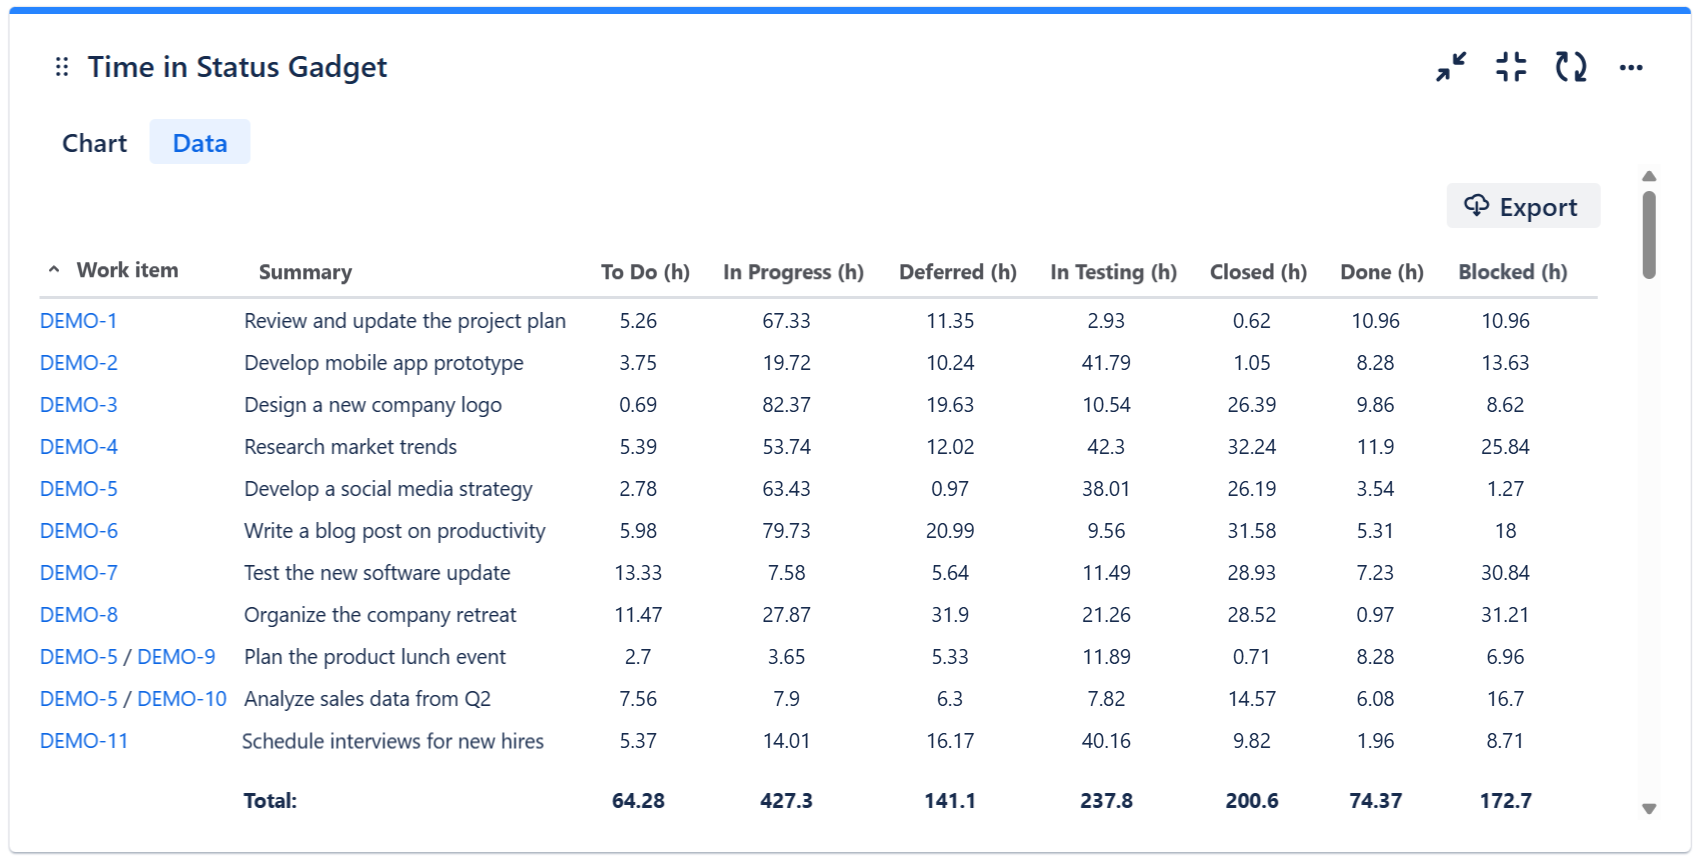
In addition to the visual chart, if you checked the option Show data tab on the More Settings tab, the gadget also displays a Data tab containing a detailed breakdown of time spent in each status for each work item. With one click, the data can be exported to CSV, giving teams a flexible way to review or report the information outside the dashboard.
💡 Tip: This gadget is fully configurable for any workflow and can be embedded as a macro in Confluence for reporting.
Why It Matters
Tracking time in status isn’t just about metrics — it’s about improving performance, optimizing flow, reducing delays and making data-driven decisions. Using this gadget helps teams and managers:
-
Identify the slowest parts of the workflow — see what parts should be optimized.
-
Understand team performance — see who delivers fast and who delivers slow.
-
Create custom dashboards for every role — everyone sees the metrics they need.
Still not convinced?
Our customer say that “This app brilliantly overcomes Jira’s limitations.” - Atlassian Marketplace review
👉 Try Great Gadgets free for 30 days and see the difference for yourself!
FAQ
Q: Can I see both total and average time in the Time In Status?
Yes! The Time In Status gadget allows you to switch between total time and average time, depending on the insights you need.
Q: Can I see total or average time in status by assignee, project or custom fields?
Absolutely. You can configure grouping to visualize the metrics by assignee, project, priority or any custom field.
Q: Can I visualize the time in status data in different chart types?
Yes! The gadget supports pie, bar, column and stacked column charts, so you can pick the best format for your team or stakeholders.
Q: Can I export a Time in Status report with a detailed list of work items?
Yes! The Data tab of the gadget displays a detailed report with all the work items and their time in every status of the workflow, which can be exported to CSV format.
Q: Can Great Gadgets measure other advanced flow metrics like cycle time or lead time?
Absolutely. The app also offers complementary gadgets to the Time in Status gadget that enable measuring advanced flow metrics such as cycle time, lead time, time between statuses, as well as histograms, trends, and percentiles. These include the Control Chart gadget, Histogram Chart gadget, and Cycle Time Trend gadget.
Q: Is Great Gadgets a good choice for measuring time in status?
Great Gadgets is certainly one of the best options for measuring time in status and flow metrics overall. It’s a strong choice if you’re looking for clear, dashboard-level visibility into time-in-status and prefer an all-in-one gadget pack that offers much more than just time-in-status reporting, rather than a highly specialized time-in-status app.
Related Resources:
-
7 Essential Team Performance Metrics To Track In Jira By Using Great Gadgets App
-
An effective dashboard for Service Desk and Customer Support teams in Jira Service Management
-