If you’ve ever tried to rely on Jira’s default sprint burndown chart gadget or report, you’ve probably run into this frustration: it doesn’t include subtasks - which means your team's actual progress might look slower than it really is. This limitation leads to misleading reports and unnecessary confusion during sprint reviews.
Many teams try to fix this by exporting work items to Excel or building manual calculations, but that's neither efficient nor scalable. Luckily, with Great Gadgets app, there's a better way to get a complete, accurate sprint burndown (and even a burnup) chart that includes subtasks - right inside Jira.
Why Jira's Native Sprint Burndown Chart is Insufficient
Jira’s built-in sprint burndown chart gadget or the sprint report are designed to count only the parent work items (like Stories or Tasks) and don’t automatically include subtasks in the calculation.
Jira’s burndown logic assumes that work only progresses when entire stories are marked “done”. This means that even if a team completes 80% of subtasks, the chart won’t move until the parent work item is closed. As a result:
-
subtasks completed during the sprint don’t affect the burndown line;
-
the sprint appears “stuck” even though work is actually progressing;
-
teams loses visibility into detailed task progress.
So, if your team breaks work into subtasks and also assigns estimates to them, Jira’s built-in burndown chart may not be sufficient for more detailed, day-to-day tracking.
How to Include Subtasks in a Sprint Burndown (with Great Gadgets App)
Luckily, there’s a better way (and it doesn’t involve Excel). Great Gadgets app offers a Sprint Burndown Burnup Chart Gadget that brings advanced sprint tracking directly into Jira dashboards. With it, you can create burndown (and burnup) charts that include subtasks, use custom calculations, and visualize sprint progress in real-time.
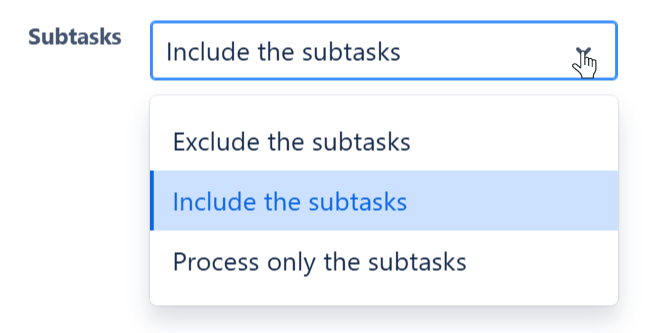
When it comes to subtasks, the gadget can be configured to include the subtasks along with the parent stories, or to process only the subtasks. Let’s see how.
Here’s how to set up the Sprint Burndown Burnup Chart:
1. Add the Sprint Burndown Gadget to your dashboard
-
Make sure you already have Great Gadgets app installed in your Jira instance. If not, you can install it from the Atlassian Marketplace: Great Gadgets for Jira Cloud, Great Gadgets for Jira Data Center, Great Gadgets for Confluence.
-
Go to your Jira dashboard and click Add Gadget.
-
Search for Sprint Burndown Burnup Chart and click Add.
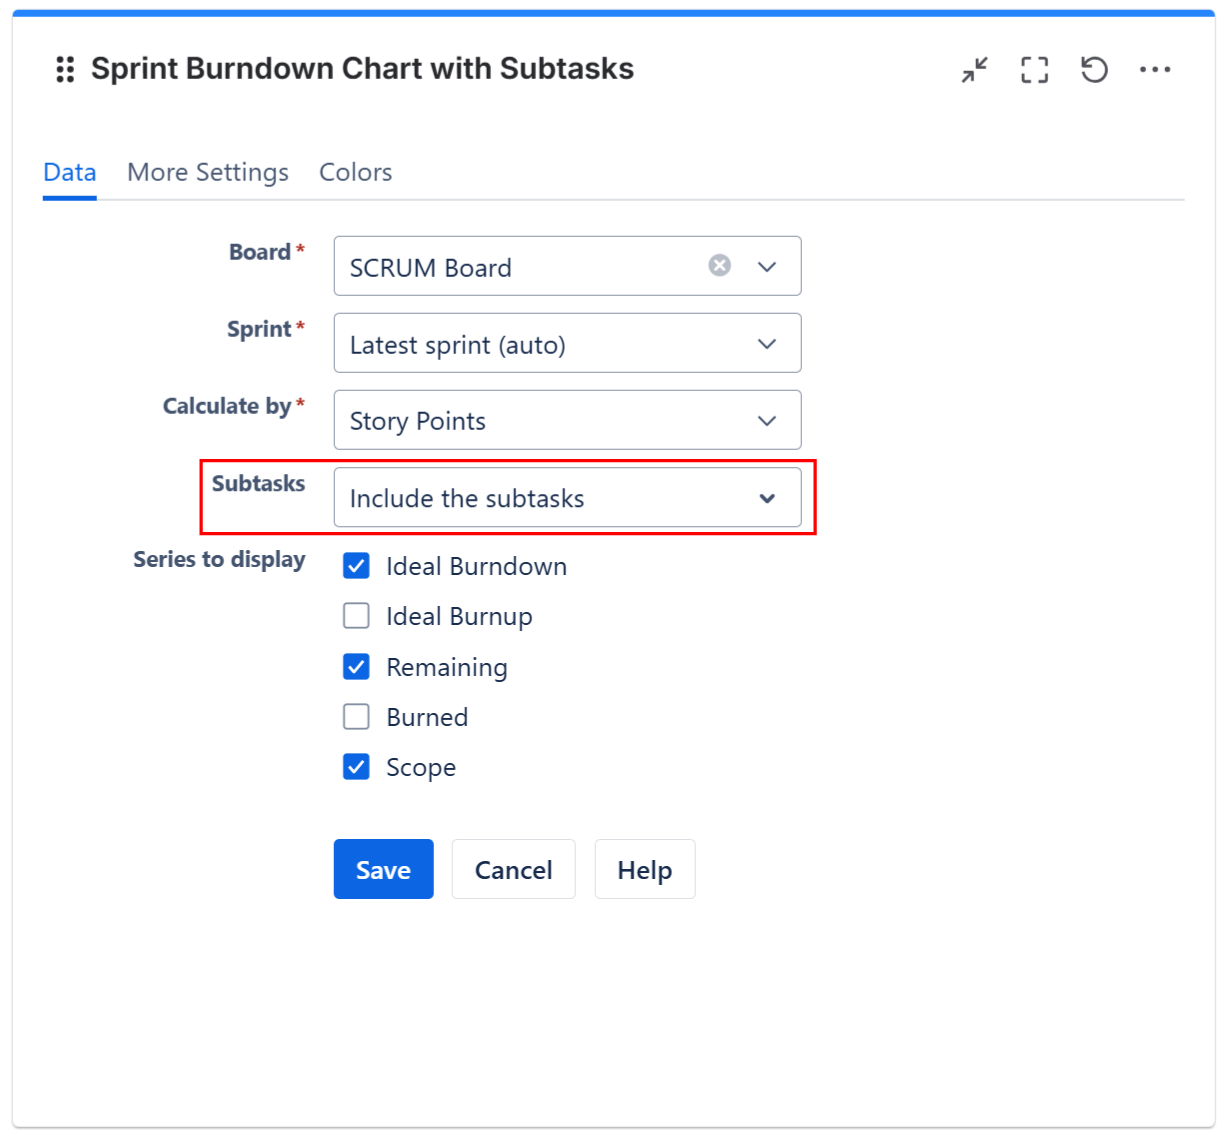
2. Configure the Gadget
-
Select the board that includes your work items.
-
Choose the latest sprint (or select a past sprint if you want)
-
Set the estimation method. The gadget supports multiple estimation methods, such as story points, time estimates, work item count, or any other numerical custom field.
-
Include the subtasks in the calculation. At Subtasks section, select the Include the subtasks option. If you want the gadget to show only the subtasks then select the Process only the subtasks option.
-
Choose the series to be displayed
-
To display a burndown chart check Ideal Burndown, Remaining and Scope
-
To display a burnup chart check Ideal Burnup and Burned
-
The Result: A Complete and Accurate Sprint Burndown In Jira That Includes Subtasks
Once configured, your burndown chart will now reflect real progress, including all subtasks completed during the sprint.
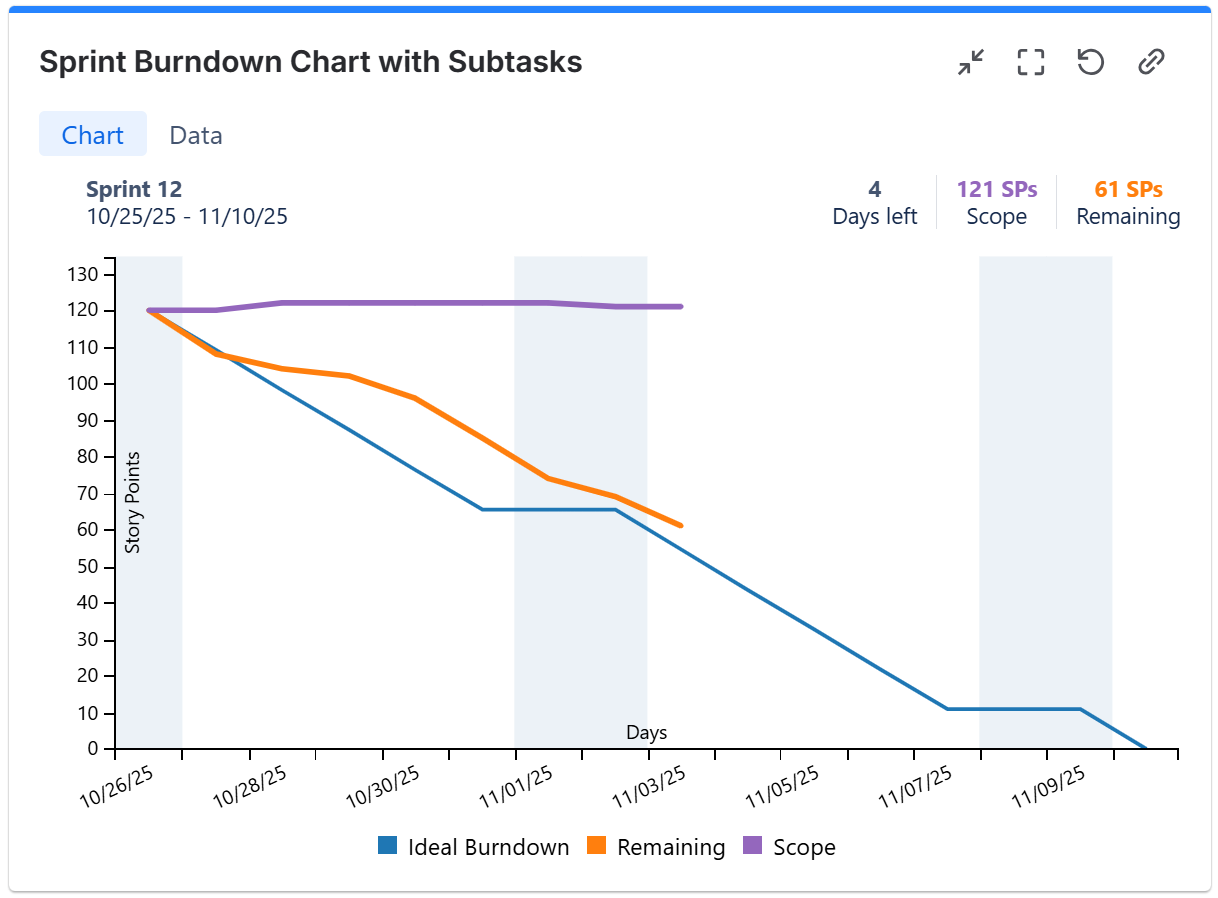
You can easily see how much work remains, how the team is performing, and whether you’re on track to finish the sprint goals.
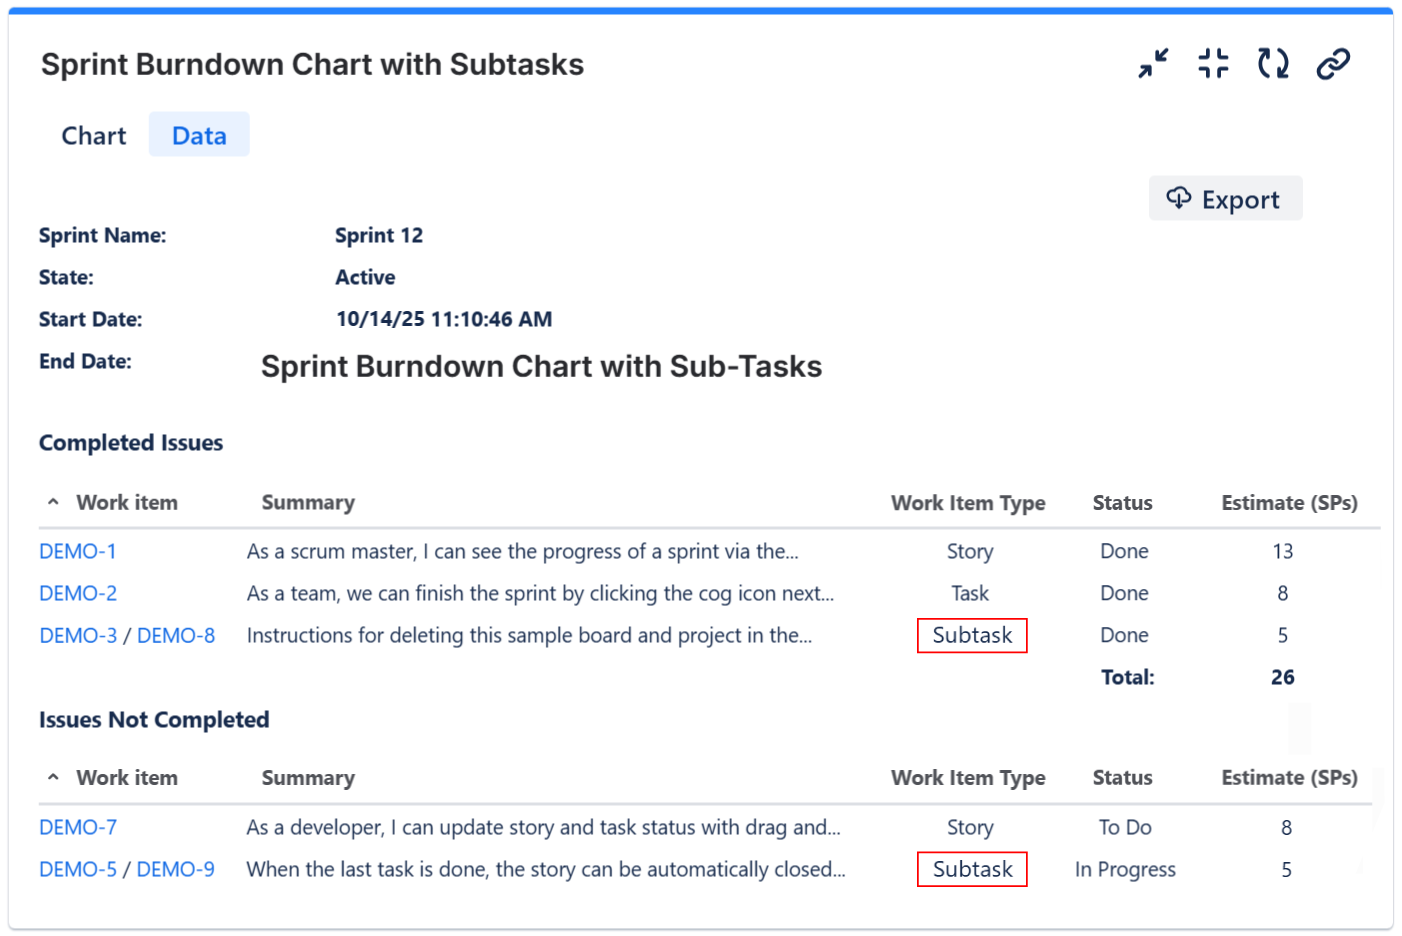
In addition to the visual chart, if you checked the option Show data tab on the More Settings tab, the gadget also displays a Data tab containing a detailed sprint report based on the current status, which displays the subtasks from the sprint.
This report includes all completed and not-completed work items, providing a clear summary of the sprint’s progress at any moment. You can also export this data to CSV format for further analysis, sharing with stakeholders, or including in sprint review documentation.
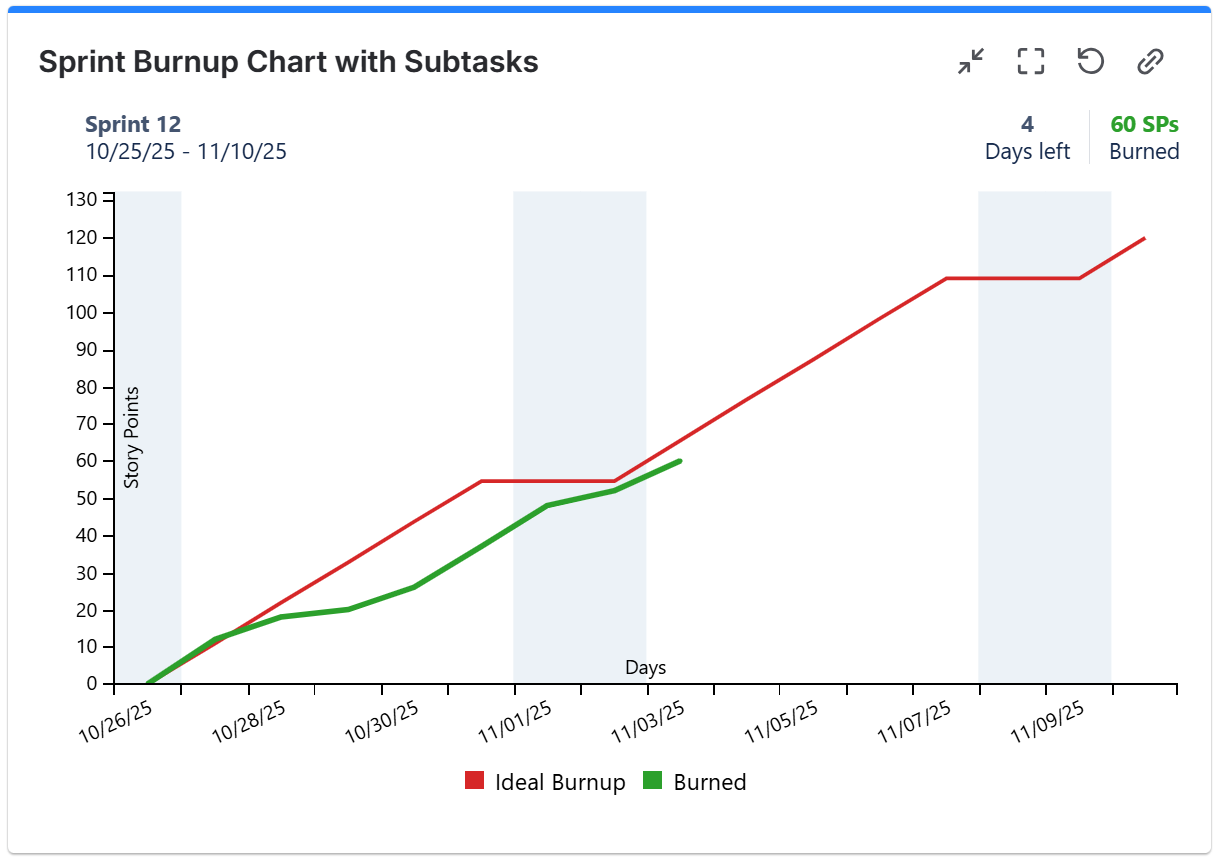
💡 Tip: What’s even more useful is that you can also configure this gadget as a burnup chart (which Jira doesn’t offer natively) - perfect if you want to visualize sprint progress in terms of work completed over time rather than work remaining.
Why It Matters
With subtasks included, your burndown chart becomes a true reflection of sprint progress. No more under-reported velocity, confusing sprint reviews, or manual Excel fixes.
This clarity helps Scrum Masters and Project Managers make better decisions, run more effective retrospectives and keep everyone informed - without ever leaving Jira.
Does Great Gadgets app offer other gadgets with support for subtasks?
Yes. Great Gadgets offers many other gadgets that can process the subtasks: Team Velocity gadget, Release Burndown Burnup Chart gadget, Cumulative Flow Diagram (CFD) gadget, Control Chart gadget and many more.
Combined with your Sprint Burndown Burnup Chart, this gives you all you need to build a powerful reporting dashboard for your Scrum project where you can:
-
Track sprint progress and remaining work in real time.
-
Measure your team’s velocity across multiple sprints.
-
Compare actual vs. planned performance.
-
Visualize how consistent your team’s delivery is.
Still not convinced?
Our customer say that “This app brilliantly overcomes Jira’s limitations.” - Atlassian Marketplace review
👉 Try Great Gadgets free for 30 days and see the difference for yourself!
FAQ
Q: Can I include subtasks in the Jira burndown without an app?
No, Jira’s native chart doesn’t support subtasks. Great Gadgets adds this functionality through dashboard gadgets.
Q: Does this work for Kanban projects?
For Kanban use gadgets like Release Burndown Burnup Chart, Control Chart, Kanban Velocity/Throughput, WIP Run Chart, WIP Aging Chart, Cycle Time Trend Chart, Histogram Chart or Cumulative Flow Diagram that can also include the subtasks in the calculation.
Q: Is there a gadget to track team velocity based on subtasks?
Yes! The Team Velocity Chart gadget from Great Gadgets lets you include subtasks in velocity calculations and visualize sprint trends side by side on your dashboard. For Kanban projects, you can use the Kanban Velocity / Throughput gadget offered by the same app.
Related Resources: