
Overview
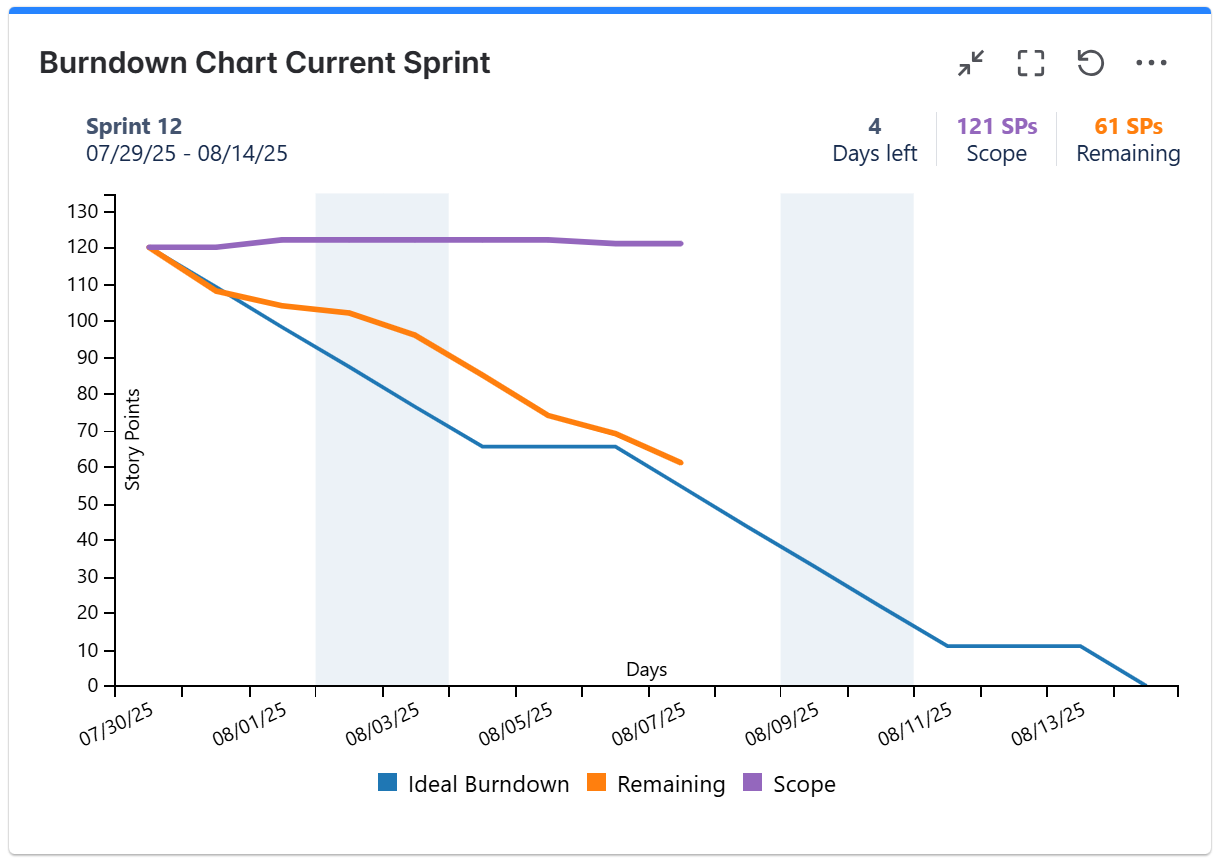
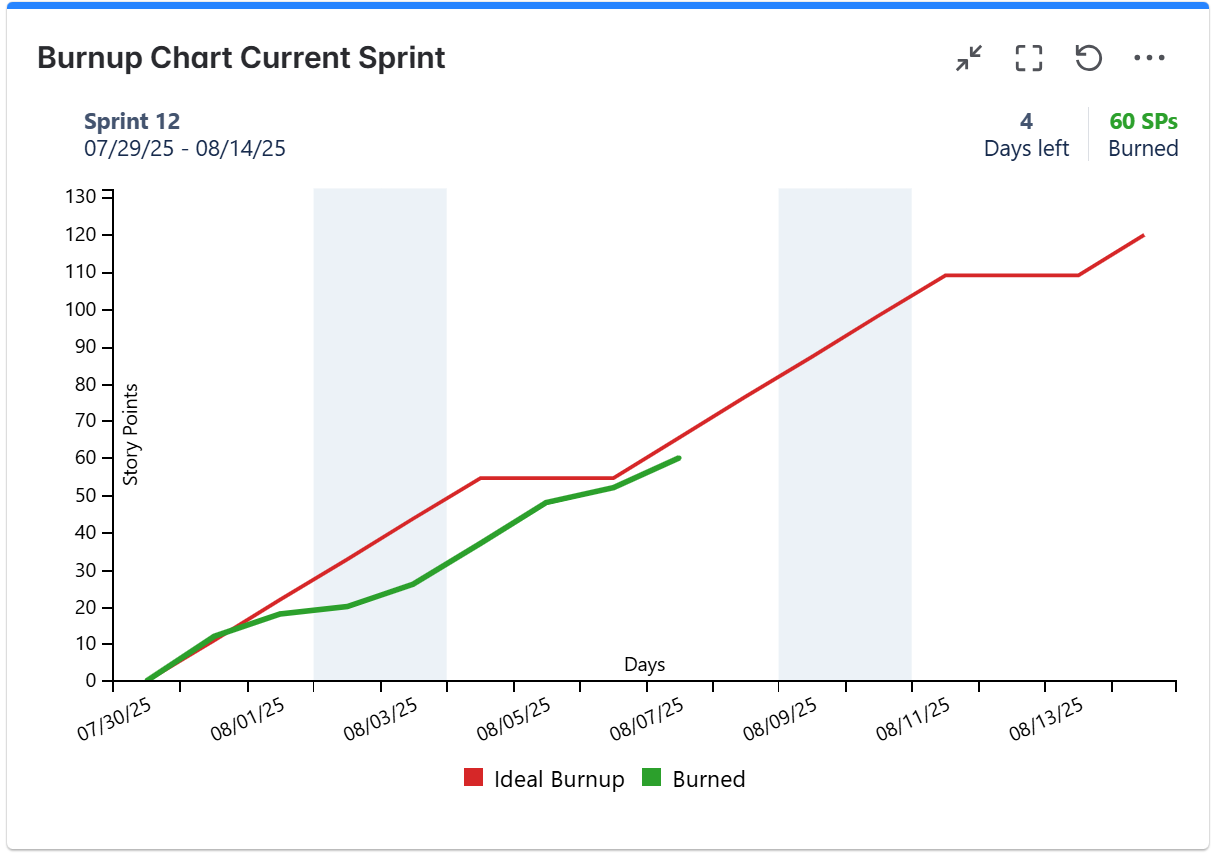
This gadget displays the burnup and/or burndown chart for a specified sprint. The calculation can be done by Story Points, Original Time Estimate, Time Remaining & Time Spent, Work Item Count or by any numerical custom field, relying on historical data of every work item in the sprint. You can also choose to include the sub-tasks in the calculation. The series to be displayed are configurable, thus allowing you to use the gadget as burndown, burnup or both.
Use this gadget effectively monitor the progress of your team throughout the sprint.
Configuration
The settings of this gadget are divided in multiple tabs:
-
Data tab - contains the required settings of the gadget, such as title or data source
-
More Settings tab - contains the optional settings, such as card colors
-
Colors tab - lets you customize the color of the lines displayed in the chart
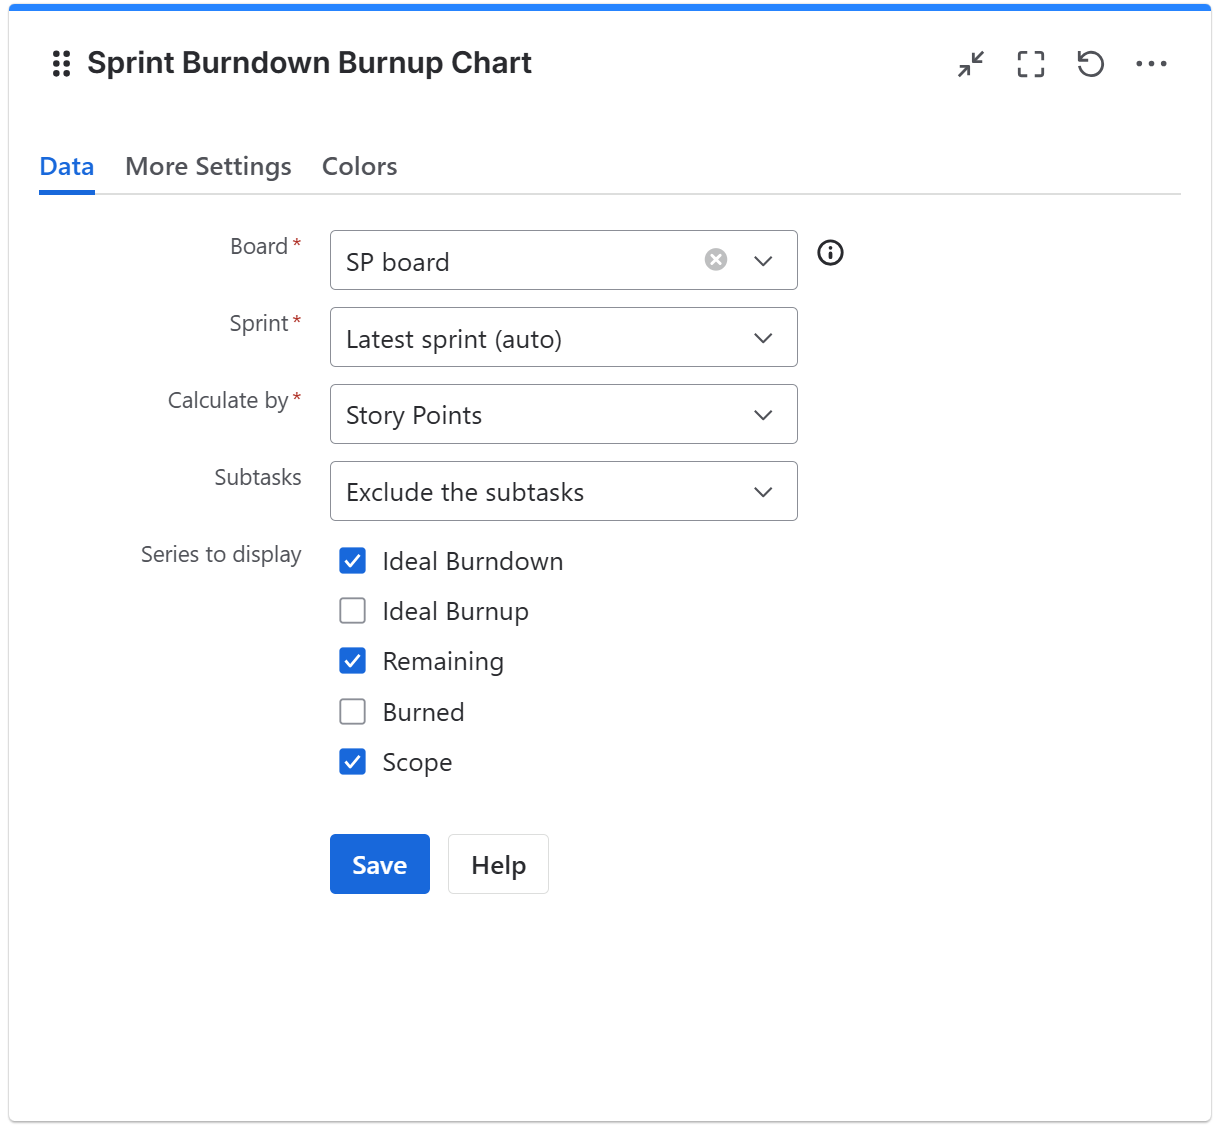
Data tab
On this tab you can configure the required settings of the gadget.
|
Setting |
Description |
|---|---|
|
Gadget Title |
Choose what to display in the title bar of the gadget. |
|
Board |
Choose the Scrum board that contains your Agile sprint. |
|
Sprint |
Choose the sprint for which to display the data.
|
|
Calculate by |
Specify on which criteria the calculation is to be performed. You can choose between:
If you check Ignore the time logged before the start of the sprint, the calculation will be based only on the work logged during the sprint. The Scope will be calculated as the sum of the Time Spent and the Time Remaining of all the work items at the time when the sprint was started. Burned is calculated as the sum of Time Spent of all the items from the sprint plus the sum of Time Remaining on all the items from the sprint that are done. Remaining is calculated as Scope minus Burned. This option does not consider the Original Estimate field. The Ignore the time logged before the start of the sprint option is available only if Calculate by is set to Time Remaining & Time Spent.
|
|
Subtasks |
Choose how the gadget should handle subtasks. You can choose between:
|
|
Series to Display |
Choose what series to display in the chart. You can select one or more options:
Tips & Tricks
Also, choose how the ideal series will be calculated. By initial scope means that the first value of the Ideal Burndown line is the value of the Scope series at the start of the sprint, while by current scope means that the first value of the Ideal Burndown line is the current (latest) value of the Scope series. This setting also applies to the Ideal Burnup line.
|
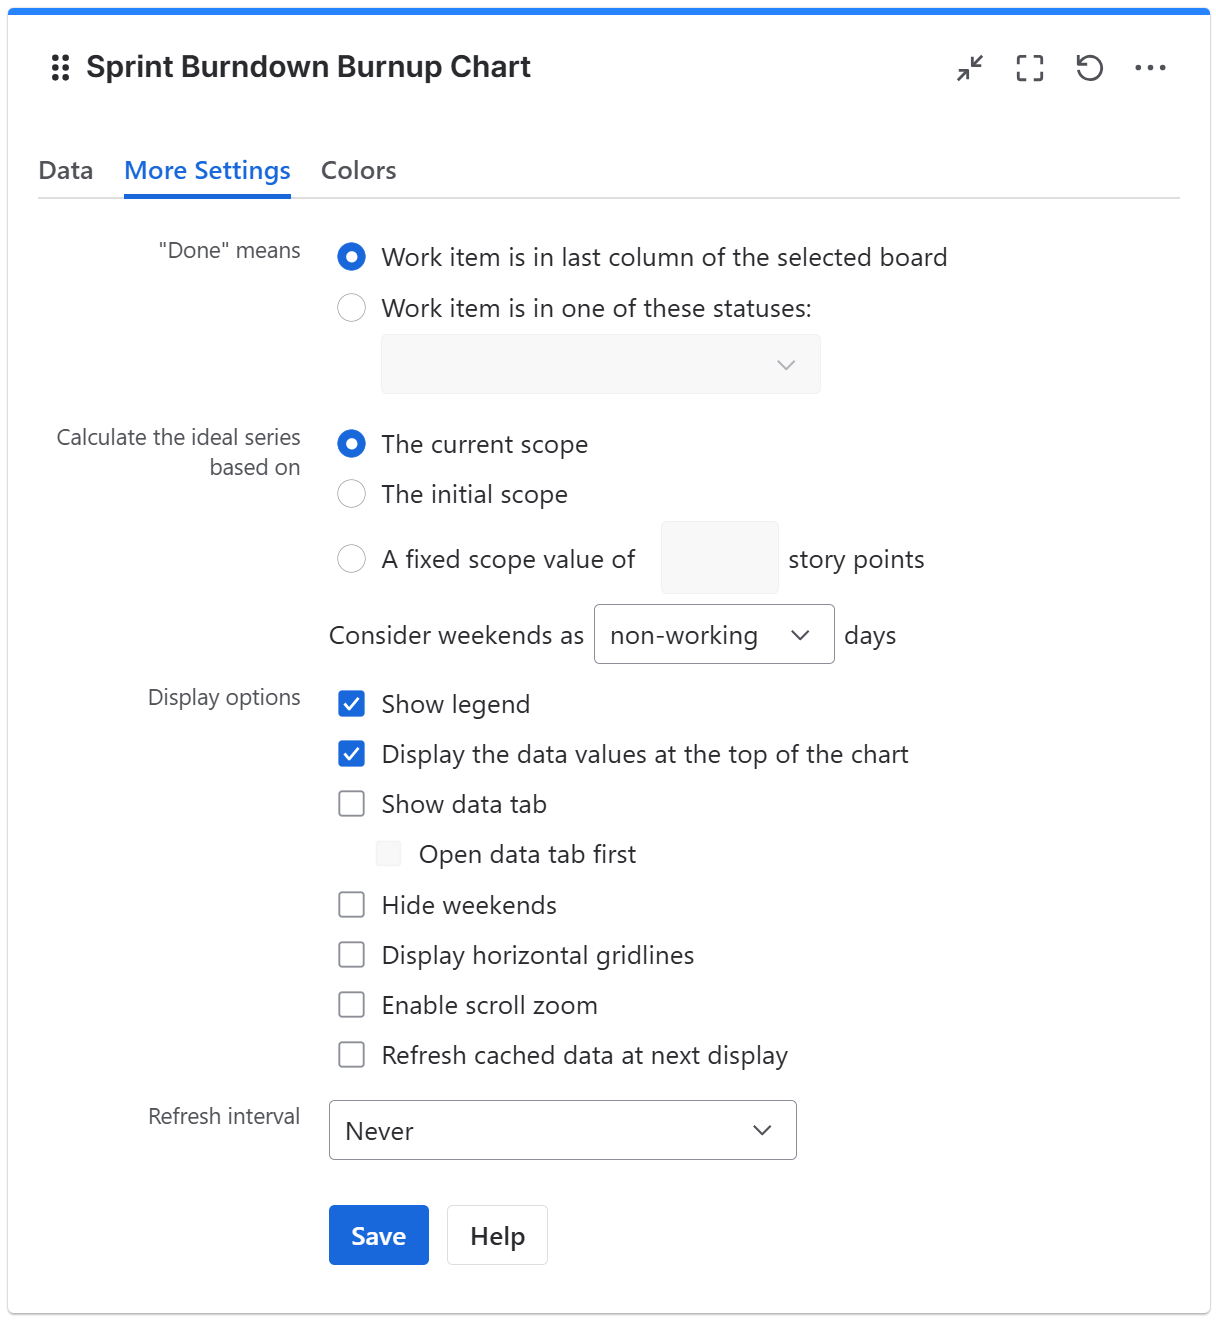
More Settings tab
On this tab you can configure the optional settings of the gadget.
|
Setting |
Description |
|---|---|
|
"Done" means |
Specify how the gadget should consider work items as done when determining the work completed. The default option is Work item is in last column of the selected board, which means that items are considered done when they reach the last column of the board or, more exactly, a status that is mapped to the last board column. Choose Work item is in one of these statuses, and then select one or more workflow statuses, to consider items as done when they reach one of these custom statuses. |
|
Show legend |
Check this if you want the chart legend to be displayed. |
|
Display the data values at the top of the chart |
Check this option if you want the gadget to display some of the key data values at the top of the chart. When possible, the displayed value also provides a link to open a filter that returns the work items that produced that value. |
|
Tilted labels for x-axis (avoid overlapping) |
Check this to avoid overlapping of the x-axis labels. |
|
Show data table |
Check this option if you want a data table to be displayed along with the chart. The Data tab displays a sprint report based on the current status, which includes a list of completed and not-completed items. 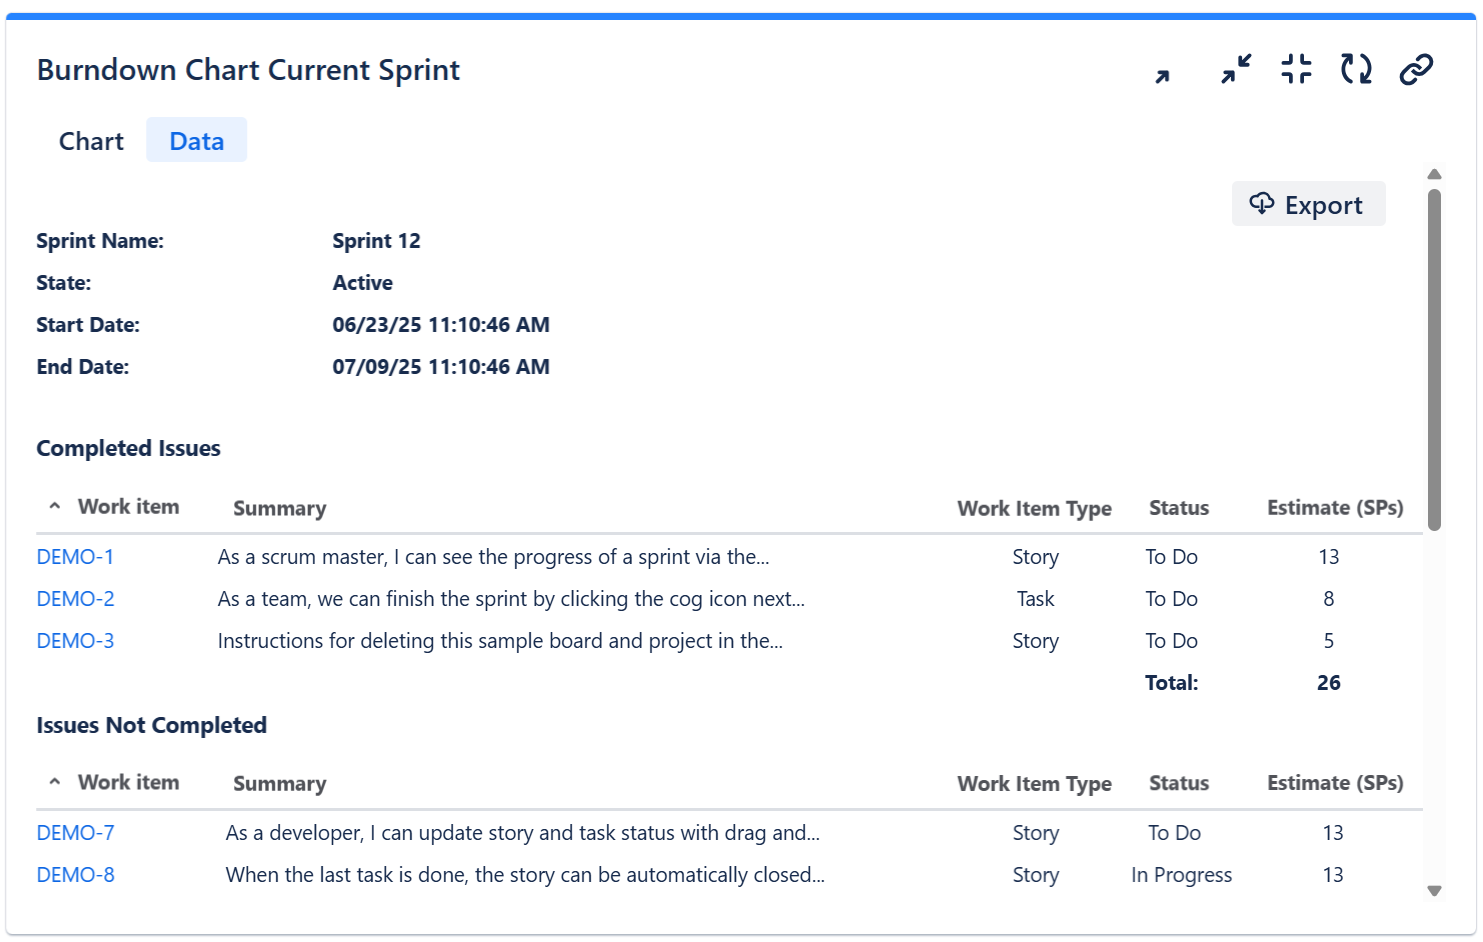
|
|
Open data tab first |
Check this option if you want the gadget to open on the Data tab first (instead of Chart tab as default). Note that the tab order will remain unchanged (Chart, then Data); only the initial view will switch to the Data tab. |
|
Hide weekends |
Check this option if you want the chart not to show weekend days (Saturday and Sunday). |
|
Display horizontal gridlines |
Check this option if you want the chart to display gridlines for the vertical axis. |
|
Refresh cached data at next display |
This gadget uses data caching for faster display, which means that some data resulted after processing are saved and reused next time the gadget is loaded. If you check it, the cache of the gadget will be deleted and recreated at the next reloading. This setting is not persistent. |
|
Enable scroll zoom |
Check this if you want to be able to zoom-in while scrolling with the mouse wheel over the chart. |
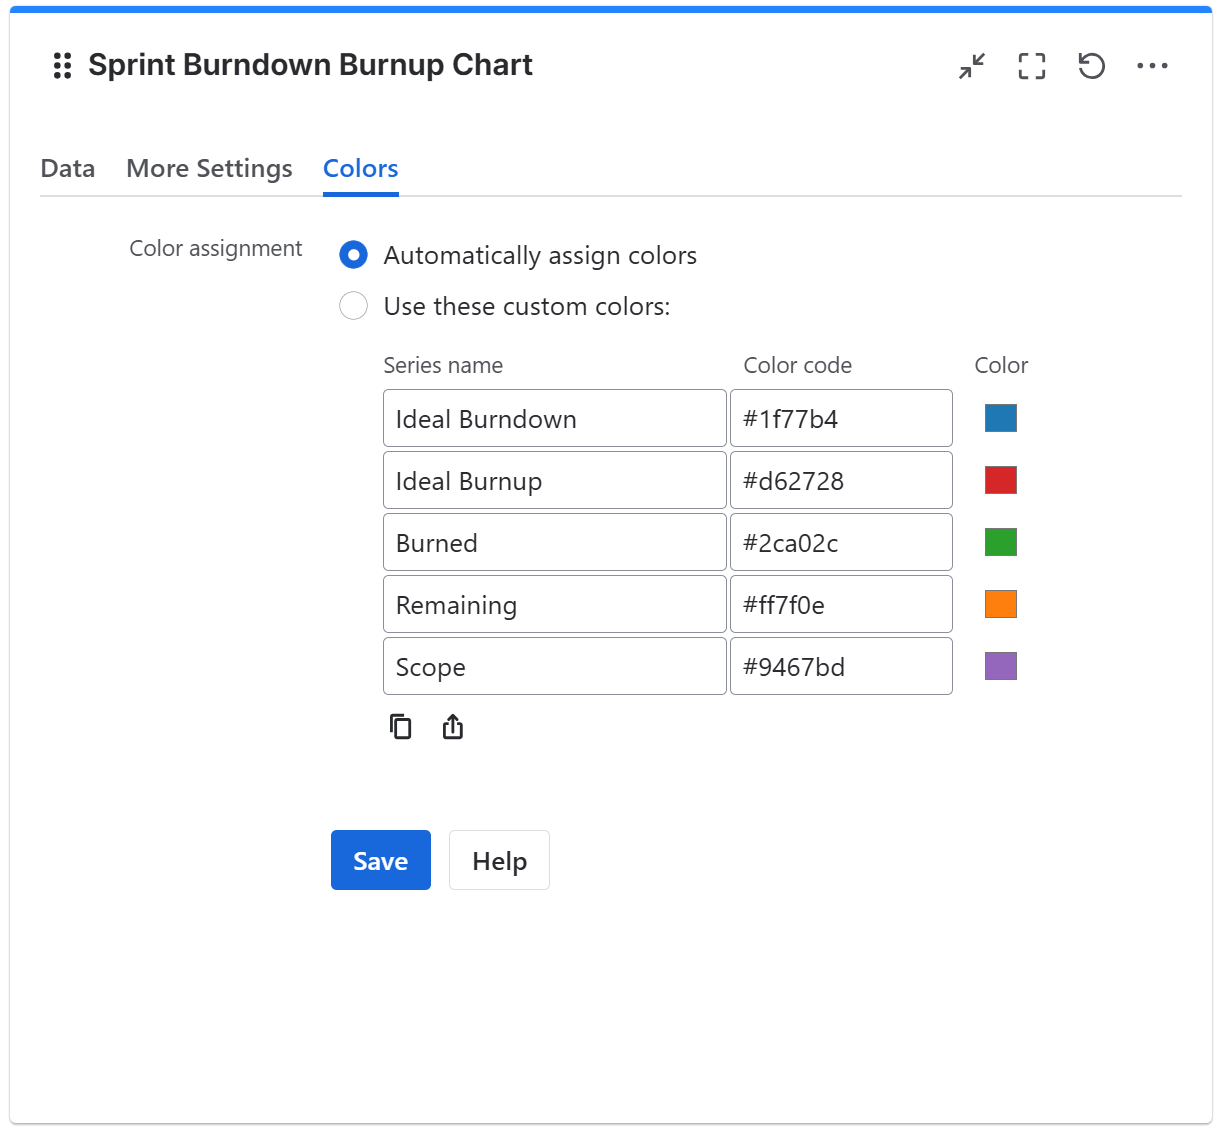
Colors tab
On this tab you can customize the color of the lines displayed in the chart.
|
Setting |
Description |
|---|---|
|
Automatically assign colors |
Check this if you want the chart to automatically assign colors for the series. |
|
Custom colors |
Select any custom color you want the series to be displayed on by either entering the color's hexadecimal code or picking a color. You can also use the Copy and Import buttons to copy and import the color configuration to gadgets of the same type. |
Related blog articles
The following blog articles provide more information on how to use this gadget.