
Overview
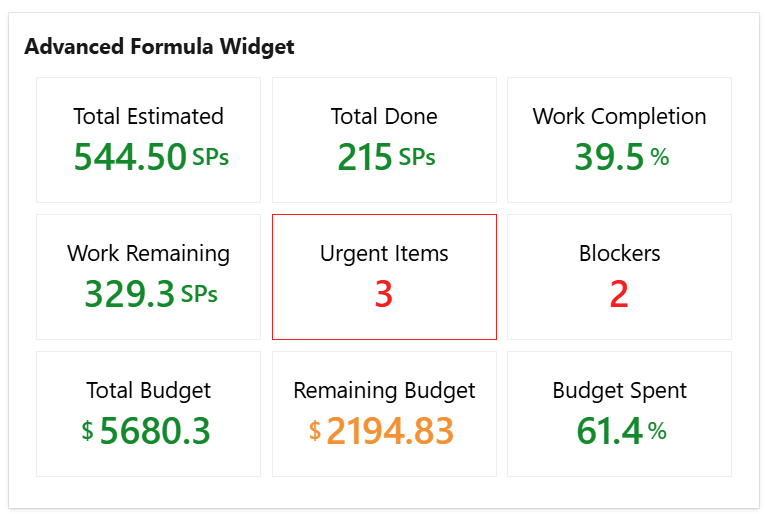
The Advanced Formula widget displays the results of multiple mathematical calculations based on numerical fields or work item count from multiple shared queries.
Compared to the standard Formula widget, it supports up to 9 calculation results instead of a single value, allows combining data from up to 9 shared queries, and enables more advanced calculations such as percentages, ratios, or custom formulas in addition to basic operations like SUM, COUNT, AVG, MIN, and MAX.
This widget is ideal for displaying key numbers, metrics, and KPIs, such as the number of urgent items, the amount of remaining work, percentage of work completion, or bug reopening ratio.
How does it work?
The widget lets you define up to 9 variables ('a', through 'i') each calculated as COUNT, SUM, MAX, MIN or AVERAGE for a numeric field from a specified query. You can then use these variables to create up to nine mathematical formulas and display the results in your dashboard, giving you a powerful tool to track and visualize multiple key metrics simultaneously.
You can also use more advanced math functions, such as SQRT, LOG, ROUND and others. For a complete list of supported functions, please see https://ezylang.github.io/EvalEx/references/functions.html.
Configuration
|
Setting |
Description |
|---|---|
|
Widget title |
Choose what to display in the title bar of the widget. |
|
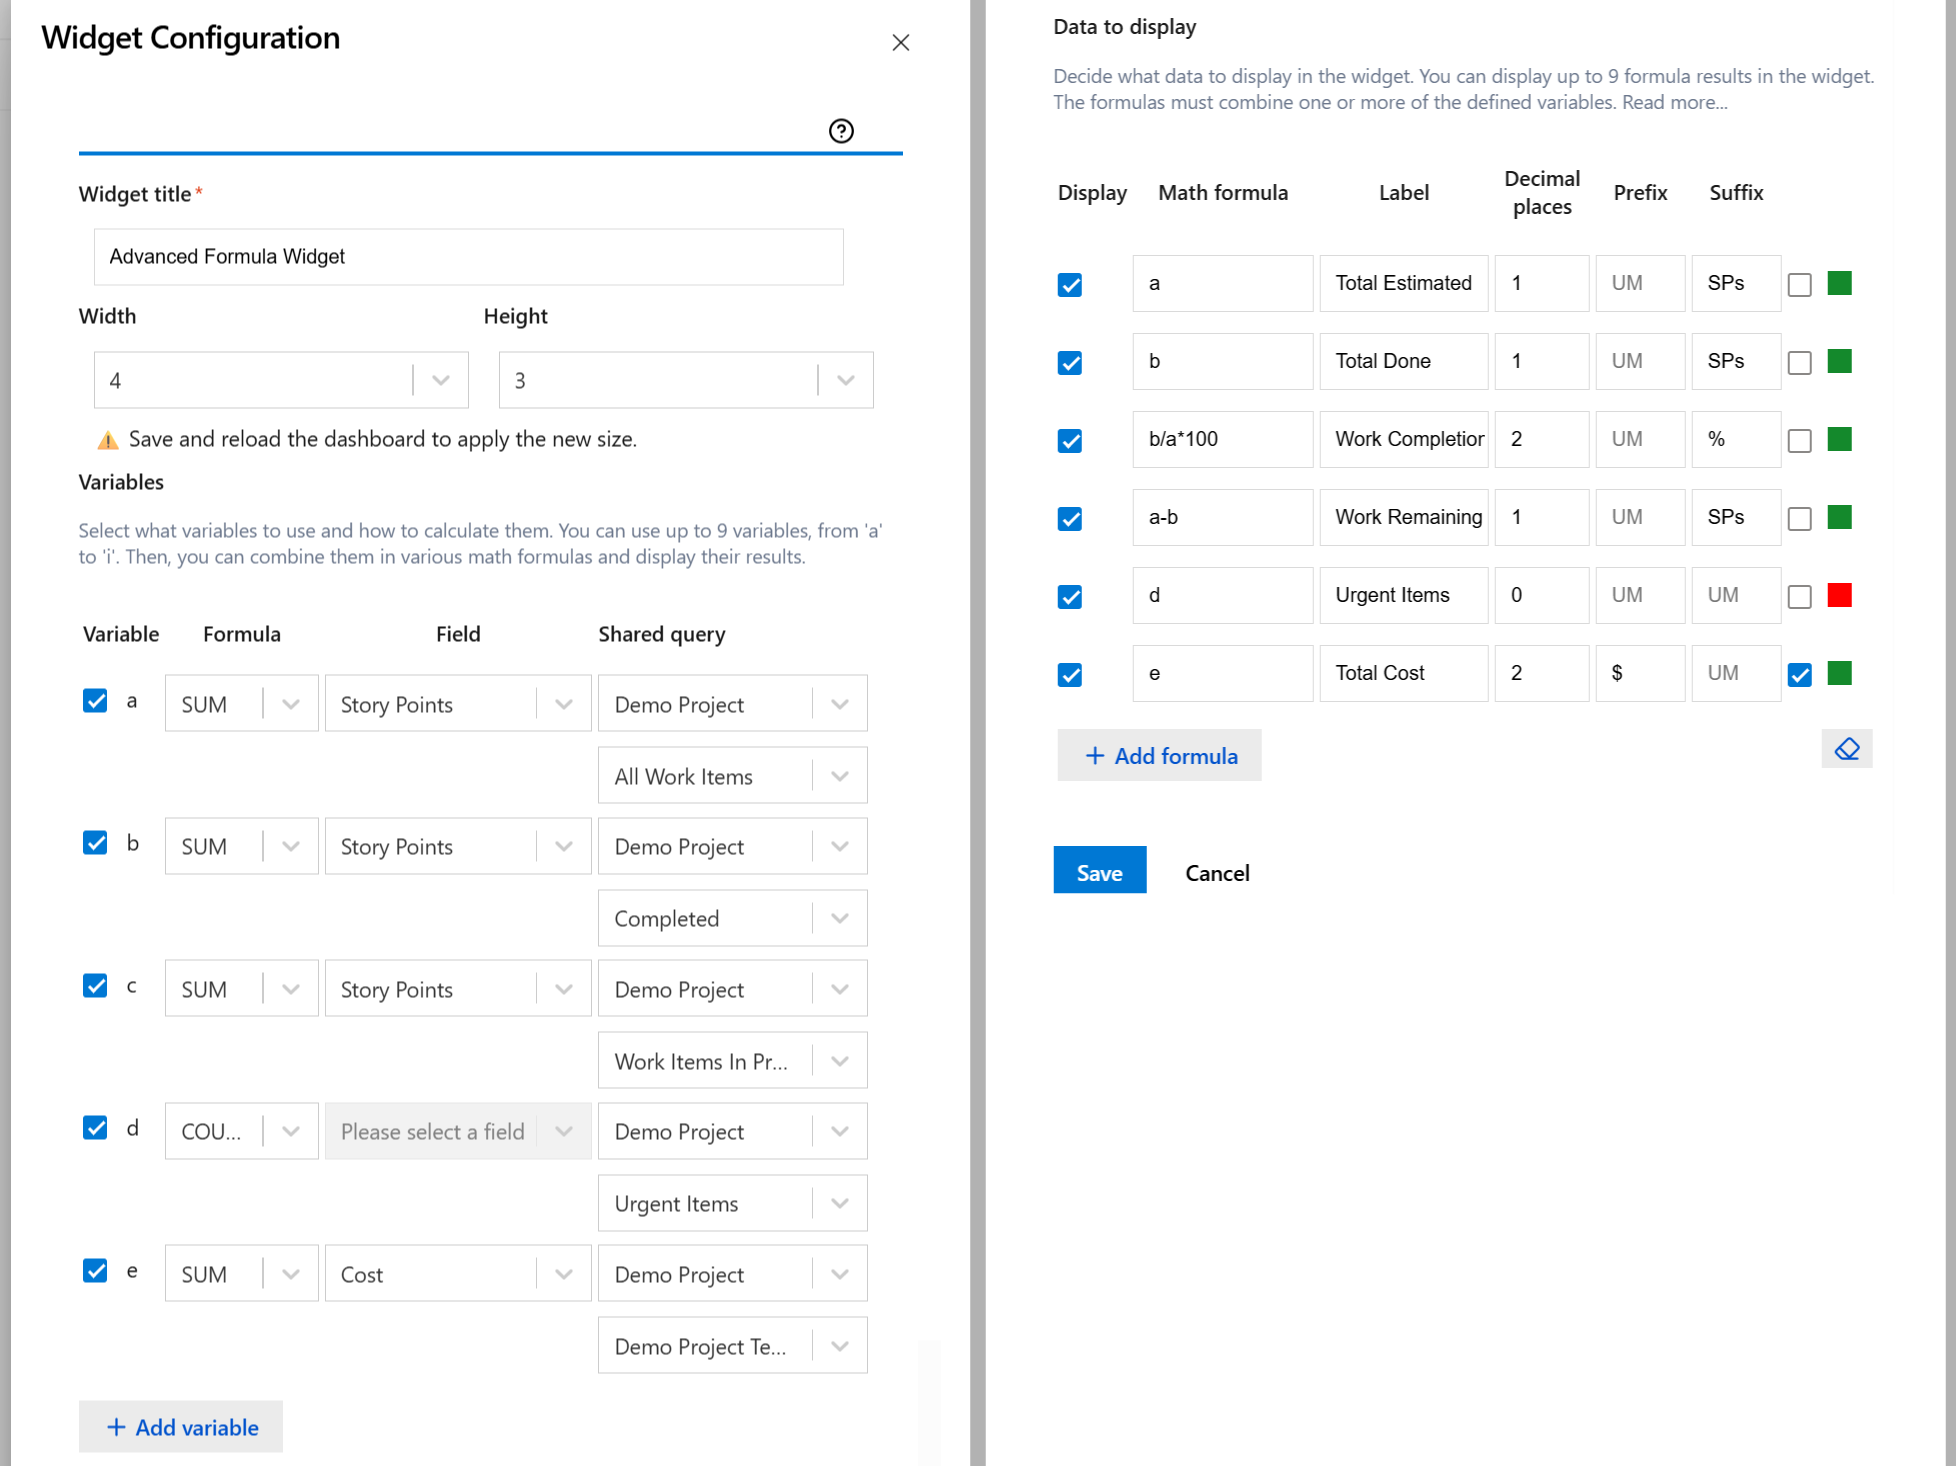
Variables |
Select the variable(s) 'a', 'b', 'c', 'd', 'e', 'f', 'g', 'h' or 'i' that you need and specify how they are calculated. By default, there are only 2 variable displayed, but you can use the Add (+) button to add up to 9 variables. For each of them, choose the Formula (SUM, MIN, MAX, COUNT or AVERAGE) that is applied against the selected Field of the worked items returned by the selected shared query. |
|
Data to display |
Choose which values appear in the widget by writing Math formulas that use one or more of the selected variables. For example:
By default, there are only 2 formula fields displayed, but you can use the Add (+) button to add up to 9 formulas. For each math formula, enter a Label and specify with how many Decimals the formula result shall be displayed.
If you enable Format with commas, values such as Color Settings You can customize the color of the displayed value by clicking the green square on the right. By default, values appear in green, but you can select any color to better match your preferences or design needs. 
Choose how the displayed results should be colored:
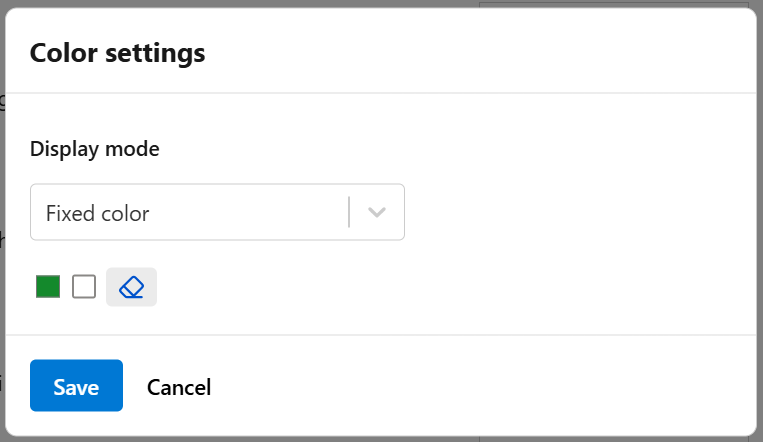
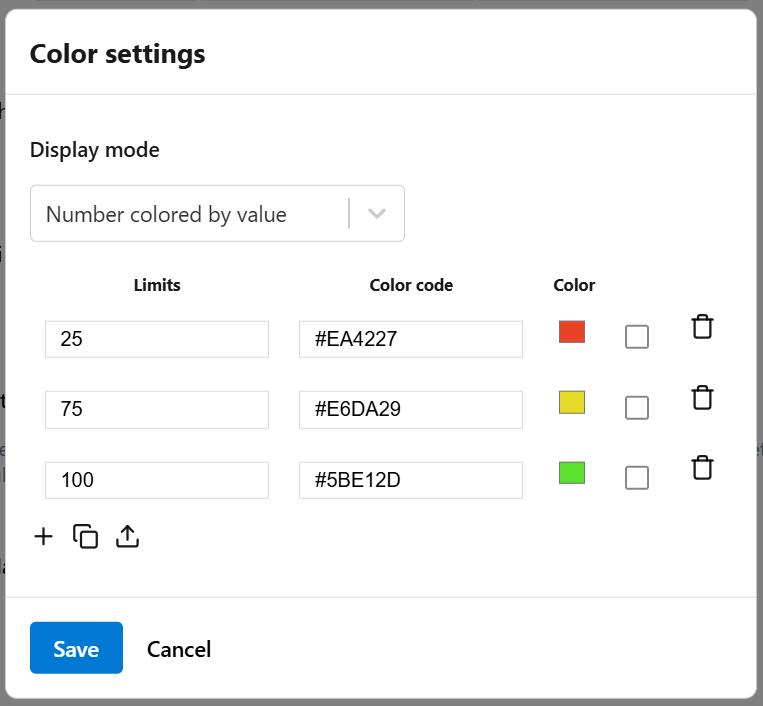
If you check Extra highlight by coloring border, the widget will color the border in the same color. 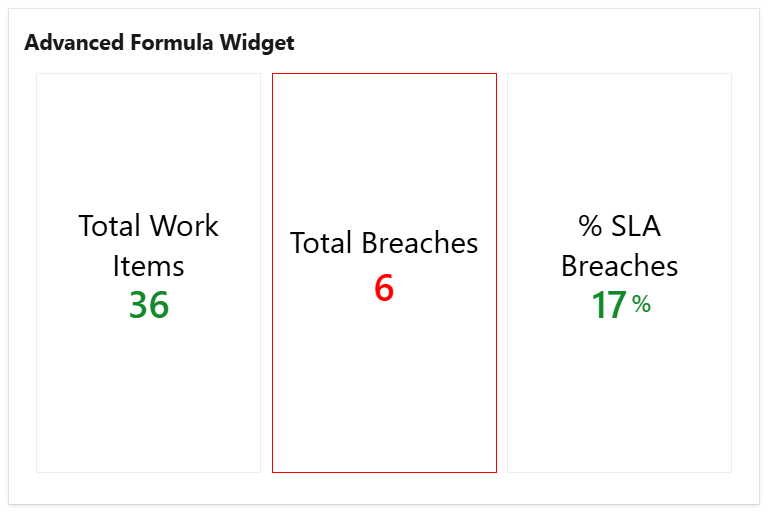
|
Example
Suppose you want to display the percentage of work completed (measured in story points) for a project. Follow these steps:
-
Create two shared queries:
-
One query that returns all items in the project.
-
Another query that returns only the completed items in the project.
-
-
Define two variables:
-
a— calculated as the SUM of the Story Points field from the first query. This represents the total estimated work (in story points). -
b— calculated as the SUM of the Story Points field from the second query. This represents the total completed work (in story points).
-
-
Display the values using math formulas:
-
a— displays the total estimated work. -
b— displays the total completed work. -
(b / a) * 100— calculates and displays the percentage of work completed.
-
You can follow the same approach to calculate and display other key project metrics.
The widget displays 'NaN' (Not a Number) if the result of the formula cannot be calculated. This can happen in case of division by zero or when one of the variables cannot be calculated (for example, the AVERAGE or MAX for a query that returns no items).