
The current version of Great Gadgets for Azure DevOps includes the following widgets:
|
Widget |
Category |
Description |
|---|---|---|
|
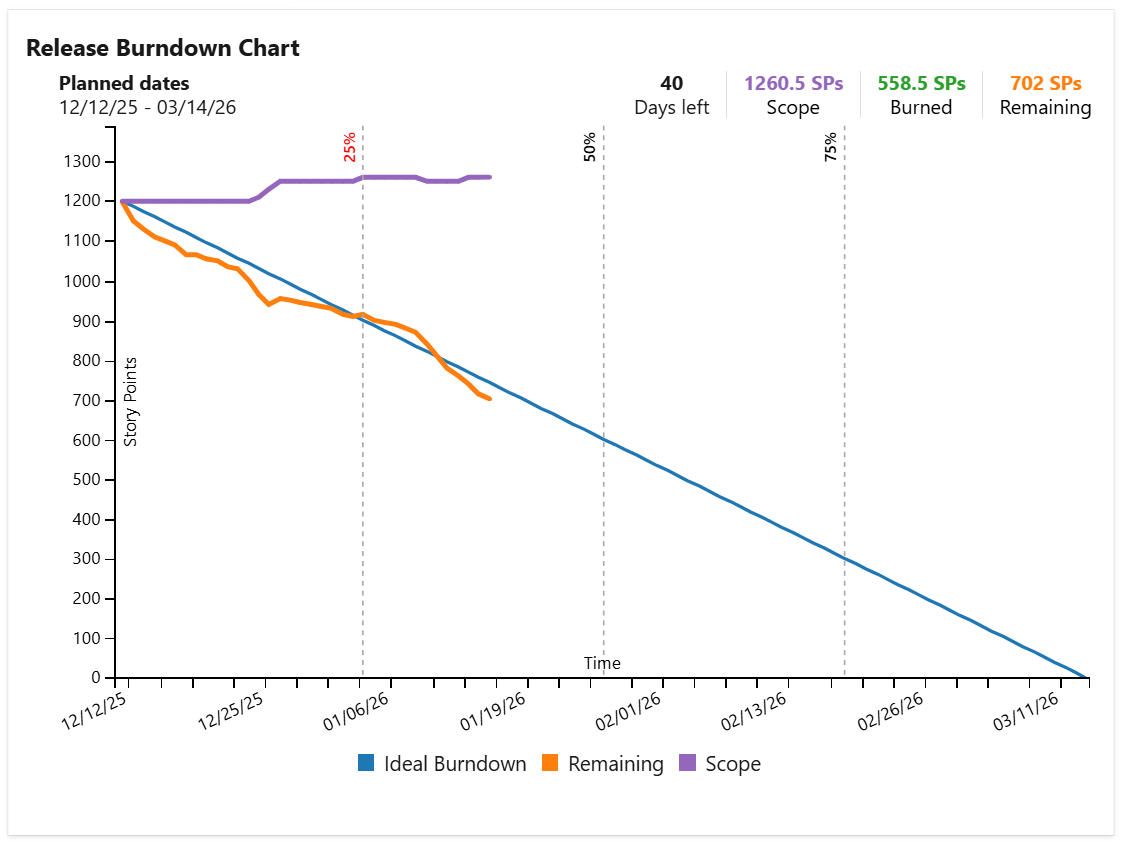
agile scrum project management release management |
Release Burnup Burndown Chart Displays the Burnup or Burndown chart for a query representing your release scope. Use this widget to track the progress of your project in an agile manner. For more details, see Release Burndown Burnup Chart . |
|
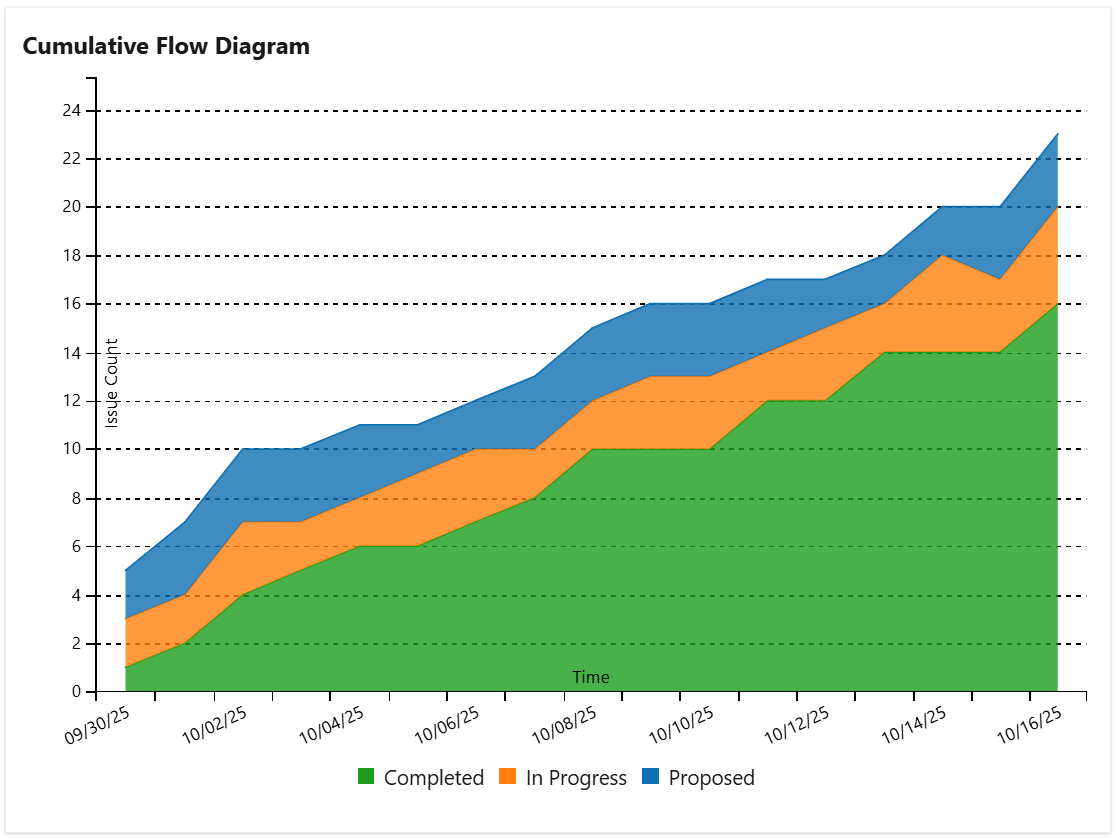
agile Kanban scrum project management release management |
Cumulative Flow Diagram Displays the cumulative flow diagram (CFD) for the issues in a query or team board. It is a stacked area chart that shows the number of tasks in each column of the board or in each status category along the time. For more details, see Cumulative Flow Diagram (CFD) |
|
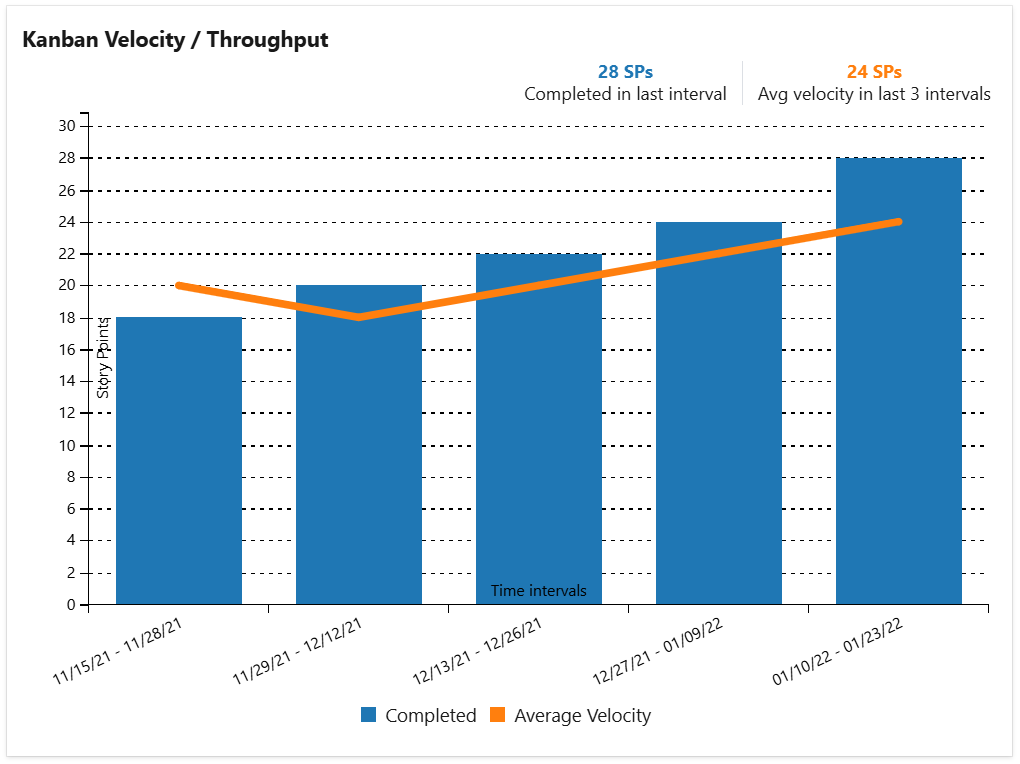
agile Kanban project management release management |
Kanban Velocity Calculates and displays the current average velocity / throughput of the Agile (Kanban) team based on a query or team board. Use this widget to see how many story points your team burns along the time. For more details, see Kanban Velocity / Throughput |
|
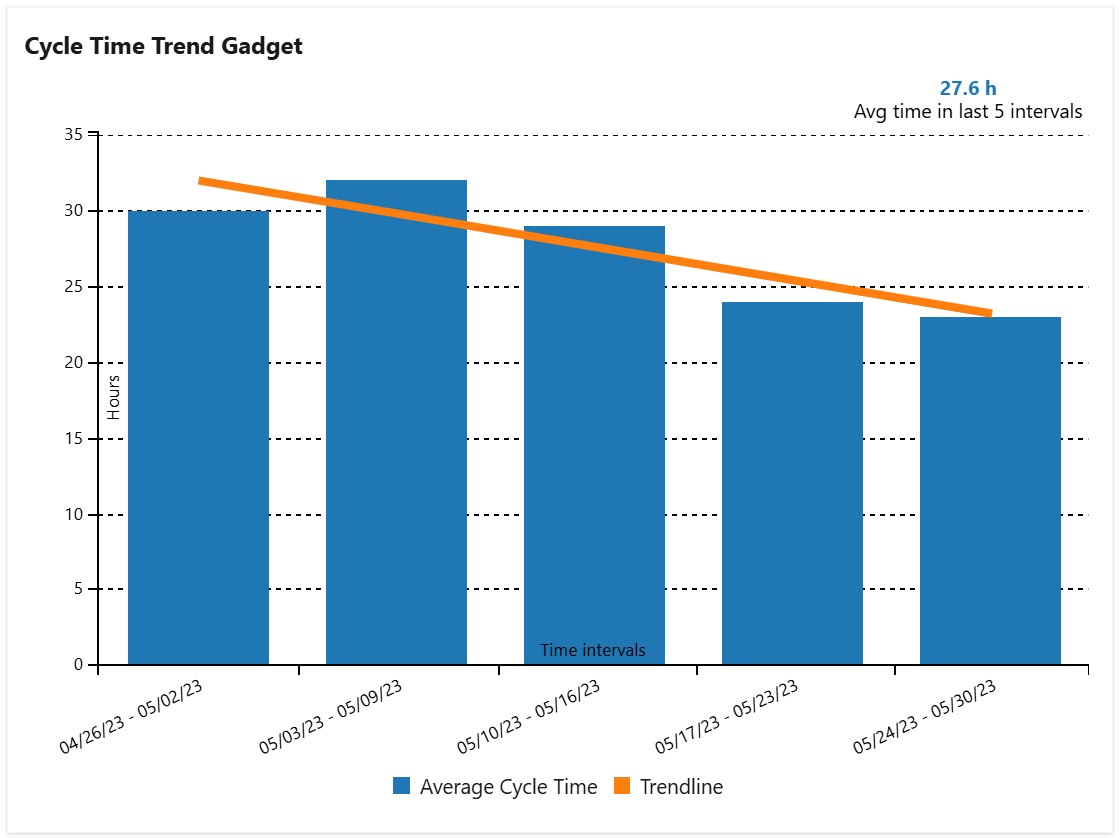
agile Kanban project management release management |
Cycle Time Trend Calculates the key Kanban metrics Cycle Time and Lead Time or simply the time between statuses and displays them as a trend chart. Use this widget to see how fast your team delivers and to identify bottlenecks in your process flow. For more details, see Cycle Time Trend |
|
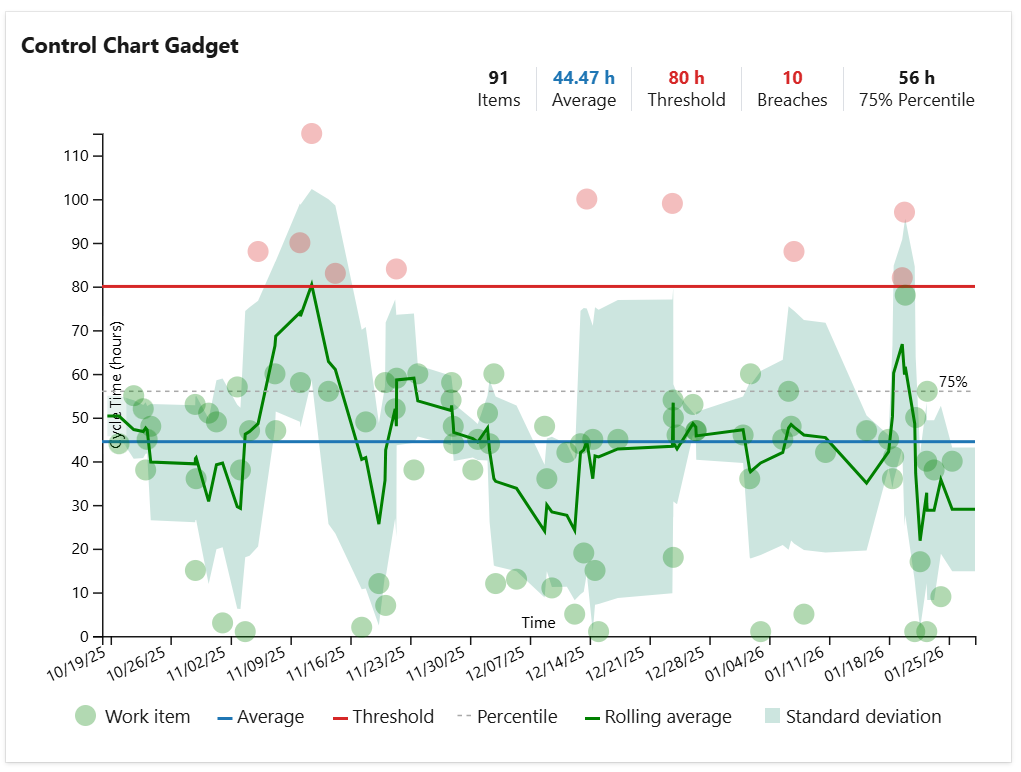
agile Kanban project management release management |
Control Chart Control chart based on the cycle time of the issues from a selected query. It shows the issues with their cycle time as well as the average line, trend (rolling average) line and standard deviation. A custom threshold line can be also added for easily identifying the issues that had an abnormally long cycle time. Use this widget to see how quickly your team delivers and to identify the issues that took longer than expected. For more details, see Control Chart |
|
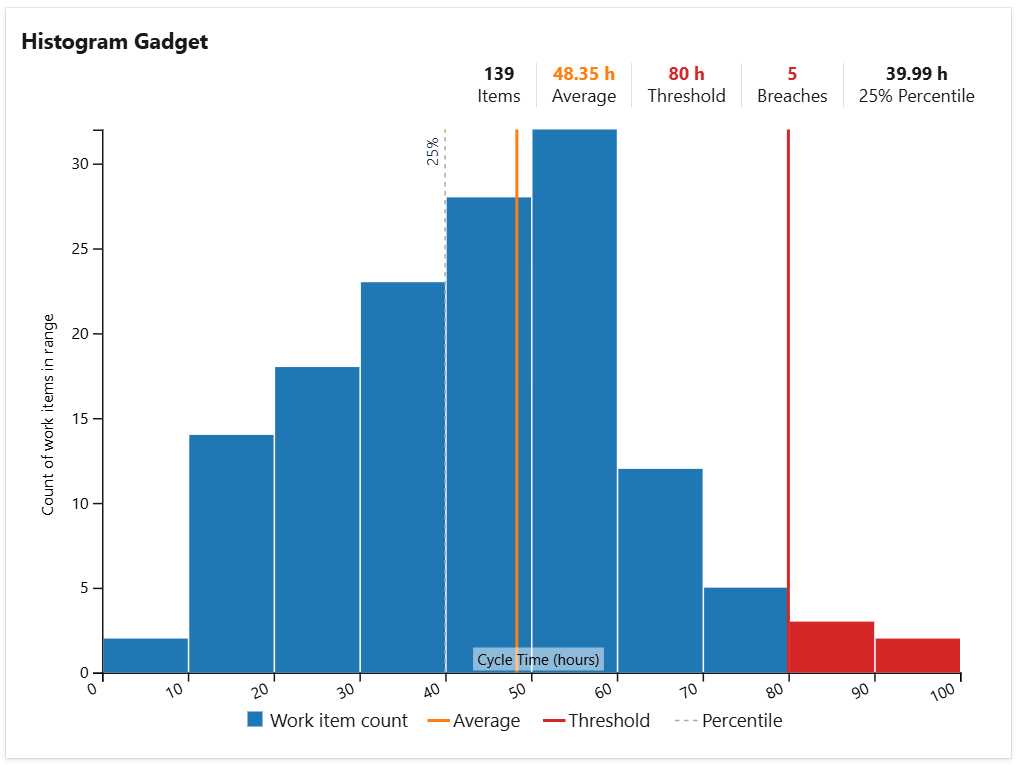
agile Kanban project management release management |
Histogram Chart Histogram chart based on the cycle time of the issues from a filter. The chart plots the distribution of the issues cycle time as a series of bars. A custom threshold line can be added for identifying how many issues had a longer cycle time than expected. Use this widget to see how your team delivers, how many issues were resolved in the expected time frame and how many were not. For more details, see Histogram Chart |
|
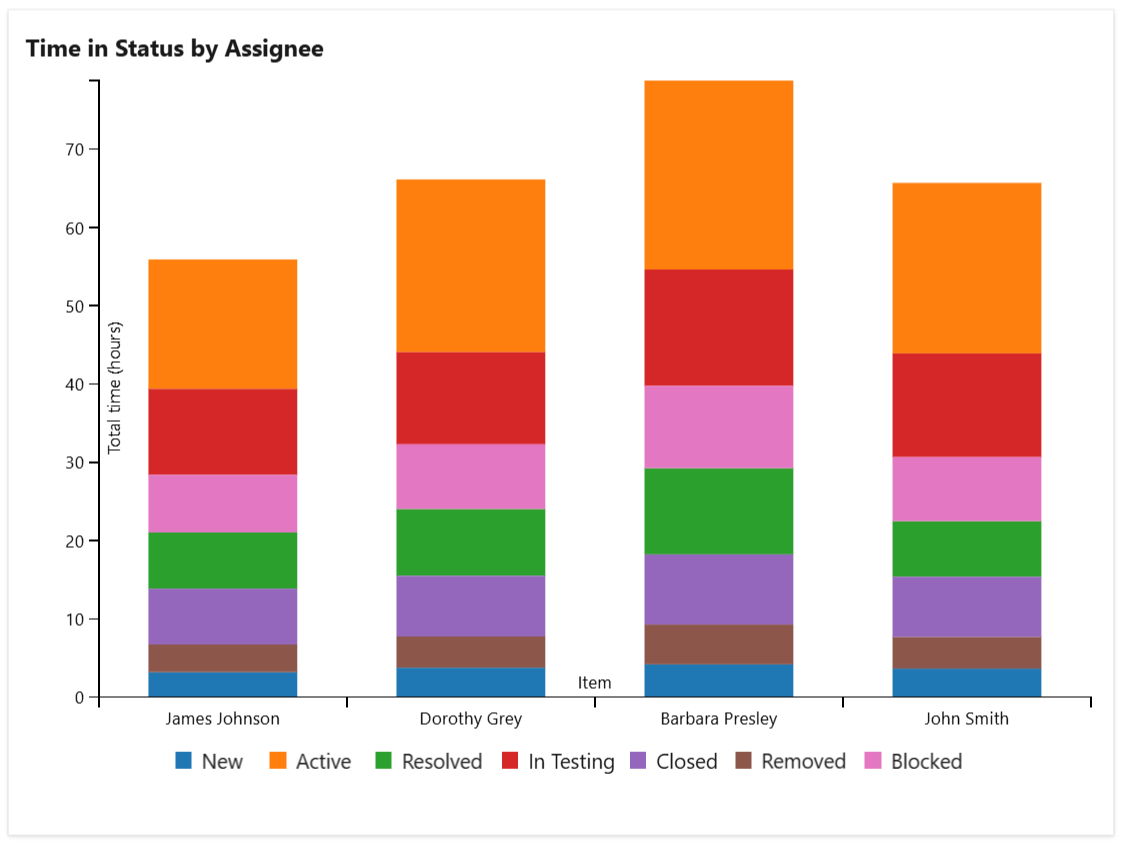
agile scrum Kanban project management release management |
Time in Status Provides real-time insights into how long issues have been in the workflow statuses. This widget is especially useful for identifying workflow bottlenecks, understanding team performance, and ensuring projects stay on schedule. For more details, see Time in Status |
|
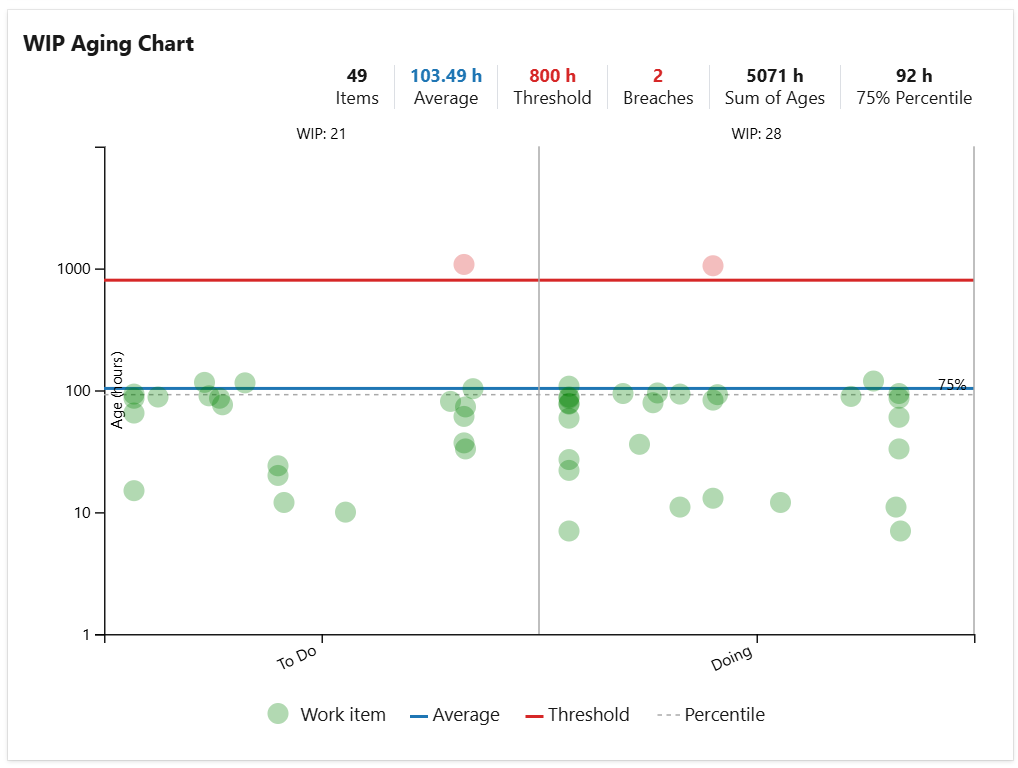
agile Kanban scrum project management release management |
WIP Aging Chart Tracks the age (time in status or time in board column) of the 'in-progress' issues from a selected query or team board. Use this chart to easily determine the work items that take longer than expected and to see if the WIP limits are exceeded. For more details, see WIP Aging Chart |
%20run%20chart%20in%20Azure%20DevOps%20dashboard.png?cb=d438decac84ace52ee0a604542226625)
|
agile Kanban scrum project management release management |
WIP Run Chart Shows how much work-in-progress (WIP) your team has over time and helps you find trends and patterns in the process. You can use this widget to determine whether your team is accumulating more "work in progress" items over time or not, and whether the team has reached an optimal work pace without exceeding their own capacity. For more details, see WIP Run Chart |
|
project management release management |
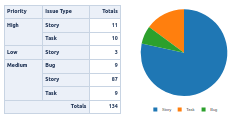
Pivot Table & Pivot Chart This widget allows you to generate and display multi-dimensional pivot tables, heat-map tables or custom pivot charts based on issues in your project using drag & drop functionality, as you do it with tools like Excel, for example. For more details, see Pivot Table & Pivot Chart |
|
project management release management |
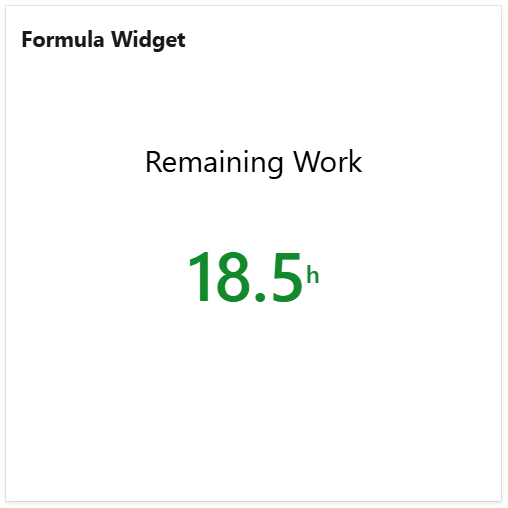
Formula Widget Calculates and displays the result of a simple formula (like SUM, MAX or AVERAGE) on a numeric field of the issues from a specified query. Use this widget to display various metrics and project key numbers, suchs as total remaining work or the total work completed in a project. For more details, see Formula Widget |
|
project management release management |
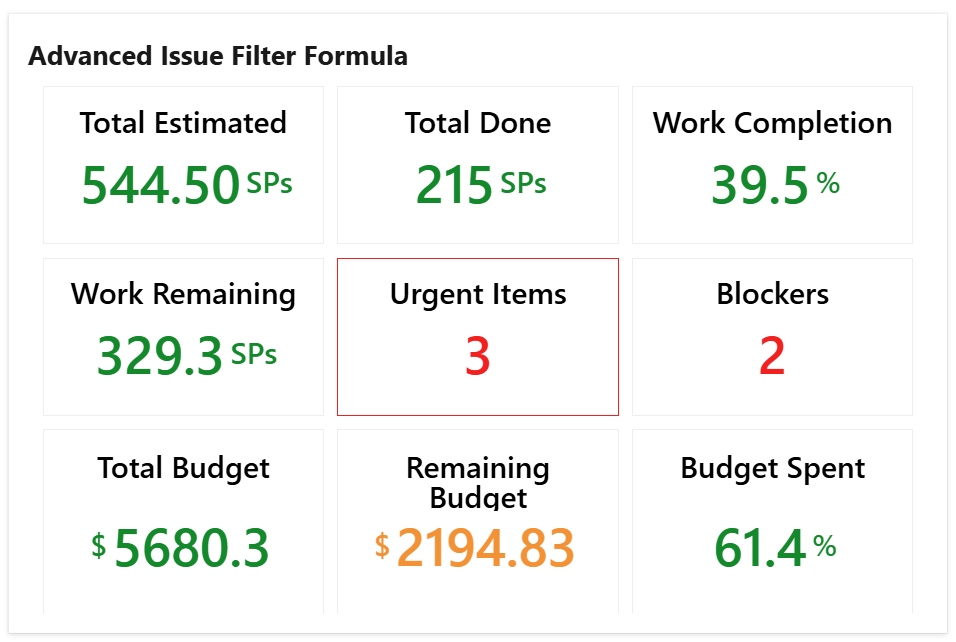
Advanced Formula Widget Calculates and displays the result of up to 9 math formulas applied against the numerical fields or count of the issues from a specified query. For example, you could use this widget to calculate and display the percent of work done or the percent of budget spent. For more details, see Advanced Formula Widget |
|
project management release management |
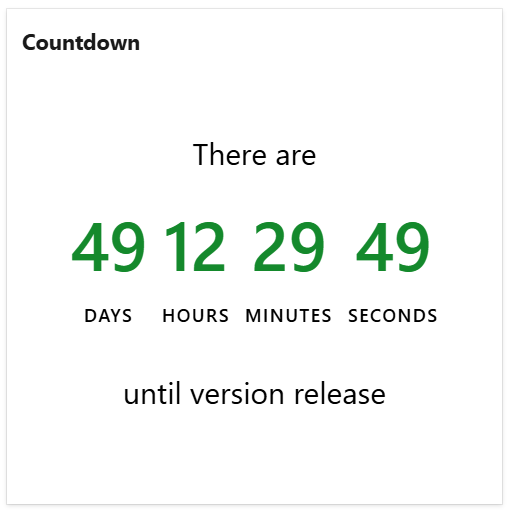
Countdown This widget shows the remaining time until an upcoming event. Use this widget to make your team aware of the remaining time until the next project launch or milestone, the Christmas Party or any other important event for your team or company. For more details, see Countdown |
|
project management release management |
Regional Clock This widget shows the current time in a specific location in a digital clock format. It is useful for companies with multiple offices across the world or geographically distributed teams. Use this widget to make your team members know what the current time is in the other offices so they can better synchronize with the remote people. For more details, see Regional Clock |