
Great Gadgets is a suite of dashboard widgets designed to make tracking your projects easier and more insightful. Each widget provides access to a different type of chart that can be configured based on your reporting needs.
You can add these widgets to your Azure DevOps dashboards to monitor progress, visualize trends, and stay on top of key metrics.
Below, you’ll find detailed instructions for using Great Gadgets effectively in Azure DevOps.
Using the widgets in Azure DevOps Dashboards
You can start using the dashboard widgets right after installing Great Gadgets for Azure DevOps. There are no post-installation steps to do.
Adding and configuring a widget
To add or configure widgets on a dashboard, the user needs permissions for the dashboard itself (team member or dashboard admin).
To add a widget to a dashboard:
-
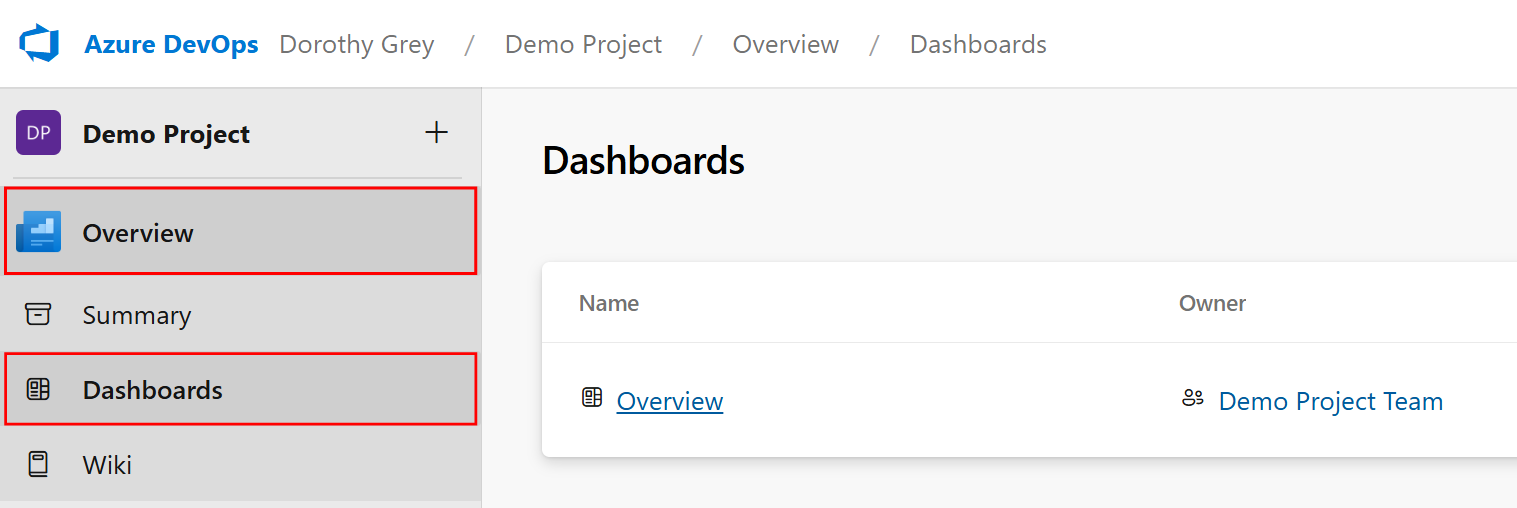
Open a dashboard: Select Overview > Dashboards
-
Create a new dashboard or select an existing one
-
Click the

-
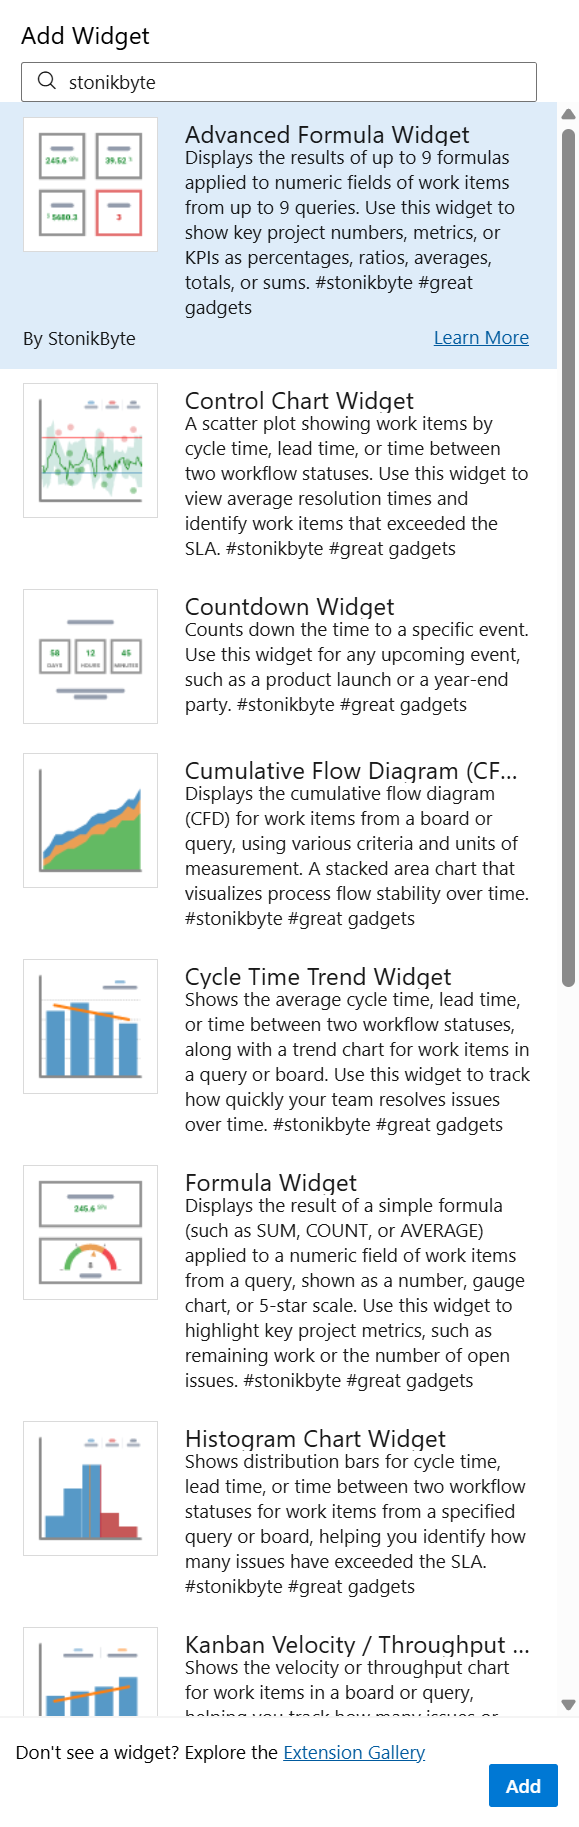
In the "Add Widget" screen, filter by "great" or "StonikByte" to display all the gadgets of the app
-
Select the widget you want to add to the dashboard and click the Add button. Or, you can drag and drop it to the dashboard.
-
Click the

-
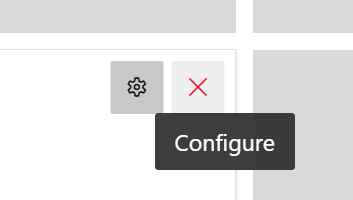
The configuration panel will open on the right side.
-
After configuring the gadget click Save